Spending Review 2013: What's the Government's record on infrastructure?
"Britain will spend on average more as a percentage of its national income on capital investment in this decade — despite the fact money is tight — than in the previous decade, when government spending was being wasted in industrial quantities." George Osborne, Spending Review statement, House of Commons, 26 June 2013
"80% of [Government infrastructure] projects haven't even started." Ed Balls, House of Commons, 26 June 2013
Government investment in infrastructure projects proved to be the most keenly-fought battleground in yesterday's much-anticipated Spending Review, with both David Cameron and Ed Miliband, and George Osborne and Ed Balls, locking horns on the subject in heated Commons exchanges.
But are their claims and counter-claims about the state of the Government's infrastructure initiatives based in fact?
A decade of higher investment?
There's a difficulty with the Chancellor's claim that this decade will see more government investment in infrastructure than the last decade. The Spending Review only covers the period to 2017/18, meaning we don't yet have a complete picture for "this decade".
We therefore have two choices: compare the decade between 2000/01 and 2009/10 with the eight subsequent years for which we have data, or look back a little further, and compare the decade 1998/99-2007/08 with the period 2008/09-2017/18.
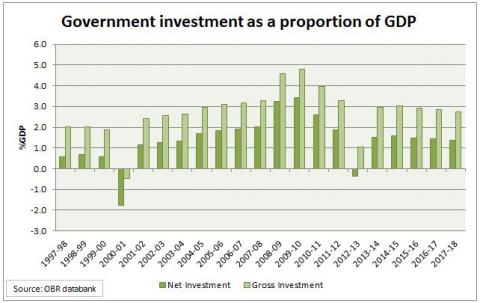
Using data from the Office for Budget Responsibility, we can see while the first ten years of the new millennium saw an average of just over 3% of GDP spent by government each year on investment projects, whereas over the subsequent eight year period, the average annual spend is forecast to be 2.8%. So if we take "this decade" to mean the period after 2010, for which the present Government has been responsible, capital spending is actually expected to be a slightly smaller share of national income. (In common with the OBR, we've used GDP as the measure of "national income", although as the IFS has shown, the picture doesn't change significantly if you use Gross National Income instead.)
However if instead we take "this decade" to mean the 10 years to the end of this Spending Review period (2008/09-2017/18) and compare it with the previous decade, the picture is reversed, and George Osborne's claim rings true.
The 10 years after 1997 saw an average government spend on capital investment projects of 2.5% of GDP, compared with the 3.2% forecast for the more recent decade.
However as the graph below shows, this doesn't necessarily tell the whole story.
With the exception of 2000/01 (where both net and gross investment figures are negative, reflecting the fact that Government sold more assets than it invested in), the previous Government oversaw year-on-year increases in investment spending since the turn of the millennium, while it has almost exclusively fallen - or is forecast to fall - in each year after 2010.
In fact, the Chancellor's figures are significantly boosted by the years between 2008 and 2011, when the country was hit by recession and GDP shrank, and when investment spending crept towards 5% of GDP. Clearly Mr Osborne couldn't claim all of the "credit" for higher spending in these years, when the previous Government was in office for most of the period.
Stalling infrastructure projects?
While the question about the relative generosity of the investment programme announced by the Chancellor yesterday is open to interpretation, his Labour shadow Ed Balls suggested that the question may be something of a straw man. What use is this money, he asked, if the projects it is meant to fund aren't being started?
According to the Shadow Chancellor, only one in five projects the Government has earmarked for investment funding has even begun.
The claim rests upon an analysis Labour did of the Government's "infrastructure pipeline" - the list the Government keeps on the progress of publicly-financed investment projects.
Looking at the pipeline, we can see that of the 576 projects tracked by the Government, 81 have the status "started", 12 are "in construction" and a further 12 are "under construction/commissioning". A further 10 projects are listed as being either partially or wholly complete. Taken together, these represent almost exactly one fifth of the projects listed, with Mr Balls assuming that the remaining 80% have therefore not begun.
Whether or not this is fair or tells us much is again contentious.
Firstly, it isn't necessarily true that no progress at all has been made on the 80% of projects identified by the Shadow Chancellor, as many of these schemes are in the preparatory stages undertaken before construction work begins. For example, 126 projects - a quarter of this cohort - are currently in the "scoping" phase, while a further 42 are awaiting planning consents.
This in itself might not tell us much about whether or not each of these projects have stalled in the early phases, however on the Government's measures at least, it might be premature to conclude from the infrastructure pipeline that there has been little progress: 166 projects are recorded as being "on schedule", whereas just nine are said to be behind.
Secondly, we should also bear in mind that these figures were released by the Government in December 2012, and some of the projects that hadn't begun at the time may have started in the intervening six months.
The state of play
Both George Osborne and Ed Balls's claims about the strength of the Government's infrastructure plans can be backed up by numbers, but neither the Chancellor nor his shadow necessarily gave the public the full picture.
Taken as the 10 year period up to the end of the Spending Review period in 2017/18, "this decade" will see higher investment than the previous 10 years as a share of GDP, but largely thanks to the higher investment and contracting economy seen between 2008 and 2011, mainly before Mr Osborne's time. Looked at on a year by year basis, investment spending largely grew after the turn of the millennium, reaching a peak in 2009/10, before shrinking in subsequent years.
Meanwhile, Mr Balls's claim that four out of five infrastructure projects are yet to get off the ground was accurate at the end of last year, it doesn't necessarily mean that schemes are failing to make progress. Only nine are listed as being behind schedule, with many of the 80% identified by the Shadow Chancellor advancing through the planning stages in advance of work beginning on site.
--
Flickr image courtesy of HM Treasury