Are complaints against doctors up by 10 per cent this year?
"Complaints against family doctors' surgeries have risen by almost ten per cent in a year."
Daily Mail, 30 August 2012
"Figures showed that more than 53,590 written complaints were lodged against local surgeries last year... up a quarter from 2007/8 when data was first collected."
Telegraph, 30 August 2012
"There were 162,100 official grievances about hospital and GP services in 2011-12 — up 12,400 in a year."
The Sun, 30 August 2012
The NHS was famously called "the closest thing the English have to a religion" by former Chancellor Nigel Lawson. More recently it took centre stage at the Olympic opening ceremony. But is our love for the institution waning?
A number of papers this morning reported a large rise in the number of written complaints filed against NHS Hospitals and Community Health Services (HCHS) and Family Health Services (FHS).
The majority of the press content focused on complaints directed at FHS, or GP surgeries in particular.
According to the Daily Mail, this influx of complaints can be in part attributed to disgruntled patients having to deal with "surly receptionists", as well as "difficulties obtaining an appointment and getting through on the phone."
But is the prognosis as bad as these figures might suggest?
Analysis
The data at the heart of these reports can be found in the latest NHS Information Centre's report: "Data on Written Complaints in the NHS 2011/12".
The report counts the number of written complaints by, or on the behalf of, NHS patients across England's service. Complaints can come in through two channels: via the HCHS and the FHS (which includes GPs and dentists).
The table below shows the results of the report, including a breakdown of the total number of NHS complaints coming from the FHS and the HCHS, as compared to previous years:
|
|
2007-08 |
2008-09 |
2009-10 |
2010-11 |
2011-12 |
Change 2010-11 to 2011-12 |
Percentage Change 2010-11 to 2011-12 |
|
All NHS written complaints |
131,022 |
137,736 |
151,832 |
149,765 |
162,129 |
12,364 |
8.30% |
|
HCHS written complaints |
87,080 |
89,139 |
101,077 |
99,057 |
107,259 |
8,202 |
8.30% |
|
FHS written complaints |
43,942 |
48,597 |
50,755 |
50,708 |
54,870 |
4,162 |
8.20% |
As we can see, the number of complaints made against the HCHS and the FHS in 2011-12 has increased by around 8 percent from 2010-11, leading to an equivalent rise in the total number of complaints written across the NHS.
Allowing for generous rounding, this could be the "nearly 10 percent" that was reported. So can we give these claims a clean bill of health?
Not quite. The report goes on to mention some caveats which have a significant impact upon the way we should understand these figures.
Foundation Trusts
The first warning is that collection for the first time in 2011-12 Foundation Trusts (FTs) were compelled to supply all data on written complaints they had received throughout the year.
Prior to April 2011, provision of these statistics was voluntary. Needless to say, not all FTs passed on the number of complaints they received, so a year-on-year rise doesn't necessarily indicate that the number of complaints received has risen, just that more have been collated for this dataset.
For example, in the 2010-11 report, 29 Trusts did not provide data, while 18 failed to do so in the previous year.
This means that, as the report notes, "overall figures for 2011-12 are not directly comparable with previous years," something that was not clear from some of the newspaper reports.
In fact, the Daily Mail was the ly paper to mention this point, albeit in a quote nestled at the end of the article.
Omissions
In a similar vein, the report adds a further reason to be cautious when comparing complaints data for GP surgeries over time.
This is because each year, a differing number of Primary Care Trusts (PCTs) claim they are unable to provide complete complaint counts data.
The report admits it cannot be sure why these PCTs were unable to respond, but makes clear that a PCT's silence may not necessarily be because they received no complaints at all. It could also be that the GP surgeries under the PCT failed to forward on any complaints they recieved in the year.
Either way, the report makes clear that changes in the number of recorded complaints could in some part be down to this fluctuating sample-size, rather than any true change in complaint-levels.
Changes in complaints procedure
The third and last caveat mentioned by the report is the introduction of a simplified complaints procedure in 2009. A greater emphasis and publicity surrounding this change is identified as a possible reason for the surge in recorded complaints from 2009 onwards.
The report therefore clarifies that the number of complaints an organisation or service receives should not be the be-all-and-end-all in assessing the quality of care being dispensed. It writes:
"An organisation that has good publicity, that welcomes complaints as an opportunity to learn and improve its services, and that has a non-defensive approach in responding to complaints may be expected to recieve a higher number of complaints than an organisation with poor publicity and a defensive approach in responding. Yet one might also expect its services to be of a higher quality."
Likewise, more surgeries adopting best practice in this area since 2009 could paradoxically lead to a higher number of complaints.
Is any increase down to "surly receptionists"?
The report breaks down the reasons provided for the FHS complaints filed in 2011-12, which can help put the reasons given in the Mail's article into context.
Using the report's chart on complaints according to subject area, we can see that 21.7 percent of complaints in 2011-12 were made about "correspondence/attitude":
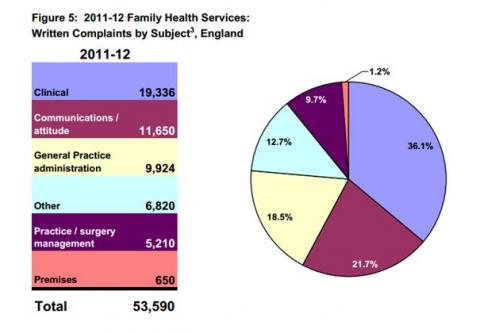
According to the NHS guide for PCTs on collecting FHS complaints, grievances placed under this heading can include those about "a contact made either face-to-face or by telephone, facsimile, email or website and issues, relating to verbal/non-verbal characteristics, or content."
This is compared to 18.5 percent of the complaints were about "General Practice administration"; defined as "activities undertaken by the reception and administrative staff within the practice."
These two subject areas would include complaints about "surly" receptionists and busy telephone lines, although it's worth noting that these categories include much besides, and are still outnumbered in terms of volume of complaints by those received concerning clinical services.
Conclusion
Although various newspapers have correctly reported the statistics on the number of written complaints filed against the NHS, they don't necessarily give the full picture when picking out the reasons for the rise.
On the surface, the figures report an increase in the number of complaints lodged, but as there has been a drive in publicity surronding the complaints service and the number of NHS authorities reporting their complaints has changed in recent years, the jump seems to owe much to the way the data is collected. As the NHS Information Centre notes, this means we should be cautious about making comparisons over time.