The rise of UKIP: how significant are the local election results?
As local election results pour in across the country, it's clear the UK Independence Party (UKIP) has stolen the show. The words 'remarkable' and 'triumphant' are already doing the rounds across some online outlets.
But exactly how significant is this rise in support?
As a lot of coverage has pointed out, the elections this year are only taking place in county councils and some unitary authorities - the same set of seats that were contested in 2009, and before that in 2005.
In 2005 UKIP didn't win a single council seat. They fared better in 2009 (on the same day as EU parliament elections), winning their first ever county council seat and 7 seats overall: four in Staffordshire, and one each in Norfolk, Suffolk and Nottinghamshire. At time of writing, the party has already secured in excess of 100 seats in these elections.
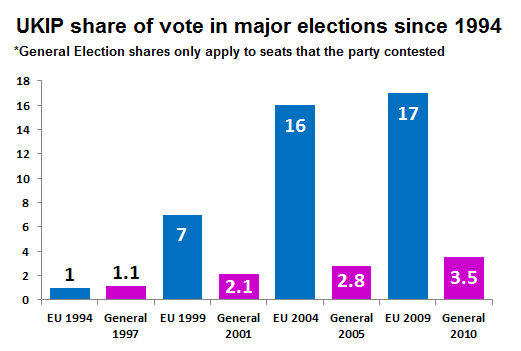
However, the party's fortunes have widly varied in the past depending on the nature of the election. UKIP poll well in EU Parliament elections, but have so far failed to break through at general elections.
The chart below shows the party's shares of the vote in major elections since 1994. For general elections, the average share per seat the party contested is shown as UKIP didn't stand in every seat.
One example of why this might still be the case even today comes from looking at two recent polls highlighted by YouGov's Anthony Wells, who recently reported on a Comres local elections poll and a routine YouGov national poll.
The Comres poll made good reading for UKIP supporters: when those 'certain to vote' asked "In the local election next Thursday do you intend to vote Conservative, Labour, Liberal Democrat or for some other party?" [not even mentioning UKIP] 31% chose Conservative, 24% Labour, 22% UKIP, 12% Lib Dem and 10% for other parties.
YouGov's top line figures were more ordinary however: 39% of all respondents would vote for Labour, 33% Conservative, 13% UKIP, 10% Lib Dem and 5% for others.
Obviously, the cohorts for these polls aren't the same, as the ComRes poll only took place in areas where elections were taking place this year, whereas the YouGov poll will cover everybody. Nevertheless, there's still evidence that UKIP support lags, as far as a general election is concerned.
This should serve as a clear word of caution to anyone tempted to conclude too much from today's results. Experts have argued on several occasions that people vote differently in local and general elections, so making projections about how parties will do in general elections based on local election results has drawbacks, although some have attempted to predict how the party's rise might effect the make up of the Commons after 2015.