BBC Question Time: factchecked
Question Time this week was in Scarborough. On the panel were: Prisons’ Minister Sam Gyimah MP, Labour MP Chuka Umunna, UKIP leader Henry Bolton, former Greek Finance Minister Yanis Varoufakis and Sunday Times columnist Sarah Baxter.
What skills are we short of in the UK?
“We as a country are short of skilled people [...] We are short of electricians, plasterers, joiners, chefs [and] nurses.”
BBC Question Time audience member, 30 November 2017
There’s no simple definition for a skilled profession in short supply in the UK. The closest measure we have is the ‘Shortage Occupation List’ which is compiled by the independent Migration Advisory Committee (MAC)—they advise the government on immigration policy.
The list is designed to make it easier for companies in the UK to hire certain immigrants, where a particular skilled profession is believed to have a shortage of workers and be in need of labour from outside the EU.
There’s also a list for Scotland specifically.
The list currently includes nurses and certain skilled chefs, as the Question Time audience member said. But it doesn’t currently include the other occupations pointed out. Many of the occupations listed are in engineering, including electrical engineers in the oil and gas industry.
Nurses were added to the list by the government in 2015 to respond to exceptional pressures on the NHS.
Being absent from this particular list doesn’t mean there are no difficulties recruiting in the sector. A survey of small and medium-sized businesses who are members of the Federation of Master Builders, for example, shows that 61% of those who responded struggle to recruit joiners and carpenters, 37% plasterers and 28% electricians in summer 2017.
Defining ‘shortage’
The Shortage Occupation List isn’t just about having a perceived shortage of workers in a profession—the MAC has to be satisfied that bringing in workers from outside the EU is a sensible policy response as well.
In essence, the Committee asks and works out the answers to three questions:
- Is the occupation skilled enough? (it has to require at least graduate level workers)
- Is the occupation in shortage across the UK, and in Scotland specifically?
- Is it sensible to bring in workers from outside the European Economic Area (EEA)?
Determining whether there’s a shortage specifically involves a complex formula, but fundamentally it’s about spotting the right set of signals that indicate there’s a shortage in a certain profession, mixed in with directly consulting organisations who actually work within the relevant industries.
Here are some of the signals the Committee looks out for:
- High vacancy rates may suggest employers are finding it hard to recruit. Some surveys also ask whether employers are having difficulties.
- Rising average wages in an occupation may indicate there aren’t enough workers.
- Low unemployment amongst people who work in a particular occupation.
- Employer actions that may indicate a response to shortages, like increasing overtime or hours worked among their existing staff.
Occupations that ‘pass’ enough of these kinds of test become classed as being in shortage, provided there’s also enough supporting direct evidence from organisations in the field.
Trade with America: are we getting a good deal?
“We have actually a trade surplus at the moment with America, although it’s a fairly modest sum of money involved. Whereas obviously we have something in the region of 65 to 70 billion trade deficit on an annual basis with the EU.”
BBC Question Time audience member, 30 November 2017
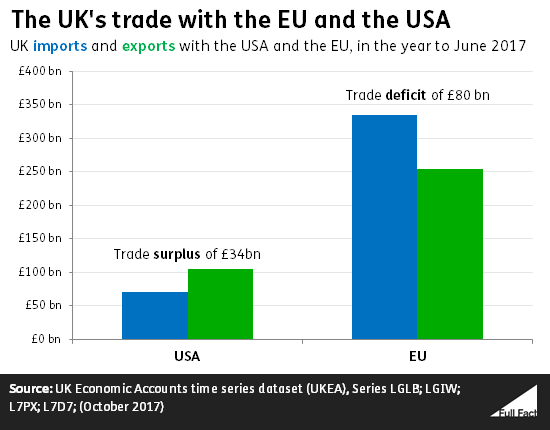
Our trade surplus with the USA was about £34 billion in the year to June 2017, using figures from the Office for National Statistics. We had a trade deficit with the EU of around £80 billion in the same time period.
Trade with the USA
The UK had a trade surplus with the USA of around £34 billion in the year to June 2017, so we export more to them than we import. In terms of services, the UK had a surplus of over £23 billion, and in terms of goods we had a surplus of over £10 billion in that time.
The USA accounted for 18% of UK exports in that period, and 11% of our imports came from the USA.
Trade with the EU
The UK ran a trade deficit with the EU of around £80 billion in year to June 2017, so we export less than we import. In 2015, the trade deficit was about £66 billion—which might be what the audience member was referring to.
This is primarily driven by goods—the UK had a trade deficit of just under £97 billion with the EU during that time. In terms of services, we had a surplus of £17 billion.
EU member states accounted for 43% of UK exports and 54% of imports. You can read more about the UK’s trade with the EU here.
These figures aren’t perfect
Although they are produced by the government, we should not treat the numbers presented here as exact. This is because of something called “trade asymmetries”.
Each country records its imports and exports separately. Trade asymmetries occur when two partner countries record the same transaction as being of different values. So, say the UK sells the USA 500 bottles of whisky, the UK may record it as worth $50,000, whereas the USA records it as $49,000.
This can be for a variety of reasons including differences in the way values are converted, the timing of the transaction being recorded and methodological differences. Trade relations are complex—using a range of changing technologies and with supply chains crossing multiple borders— so it’s hard to measure these relations exactly.
These can lead to quite dramatic differences. In 2014 the UK recorded that it had a services trade surplus of $44.8 billion with the USA. However, the USA thinks that should be a deficit of $13.3 billion. That’s a difference of $58.1 billion.
All countries have trade asymmetries, and the UK’s are similar to other countries’, according to an analysis by Eurostat.
Has the number of people starting apprenticeships fallen?
“There's a real crisis on the apprenticeship front because over the last quarter, the number of apprenticeship starts has fallen by 70%.”
Chuka Umunna MP, 30 November 2017
This is correct. The number of apprenticeships started in England in May to July this year (48,000) was 72% lower than in February to April (173,800), according to official statistics. Comparing quarter to quarter in the same year is not necessarily the best measure, because some differences might be due to the time of year. The fall in apprenticeship starts is 59% when comparing to May to July last year (117,800).
Earlier this year, starts had increased compared to the year before.
One reason put forward for the recent decline—by bodies such as the trade organisation EEF, and business body the CBI—is the introduction of the new apprenticeship levy, which came into force in April 2017.
This new funding system requires all UK public and private sector employers with an annual pay bill of more than £3 million to pay a levy of 0.5% on their pay bill. Business that employ apprentices are then able to access some of these funds to help pay their apprentices, with a top up from government.
A number of business groups have criticised the design of the levy. For example, the EEF has said the levy is too complex and has proved difficult for employers to access funds in time. Some others have been more positive but say there needs to be greater awareness of the new system.
Government statisticians commented on the effects of the new levy that “It may take time for organisations to adjust to the new funding system, and so it is too early to draw conclusions based on the number of apprenticeship starts recorded since May 2017.”
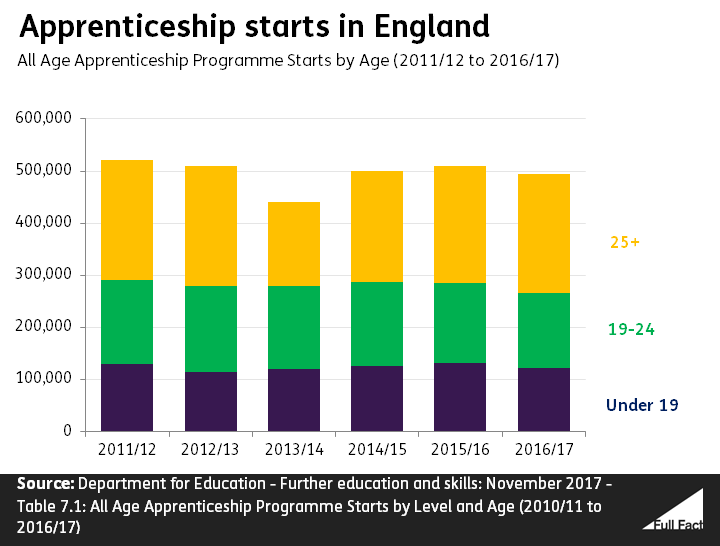
Overall, there were 494,900 apprenticeship starts in 2016/17—a fall of 3% since 2015/16, when there were 509,400.
The number of apprenticeship starts has fluctuated in the past few years. The lowest number of apprenticeship starts in recent years was during 2013/14.
If someone has started more than one apprenticeship in the same year, they will be counted more than once.
There have been questions about the quality of apprenticeships and success of the policy, which we’ve written about here. The Institute for Fiscal Studies has also written more recently about this here, including on the new funding system.
About one in five people live in absolute or relative poverty if their housing costs are included
“One in five people lives in absolute poverty, over 14 million people are living in absolute poverty in our country.”
Chuka Umunna, 30 November 2017
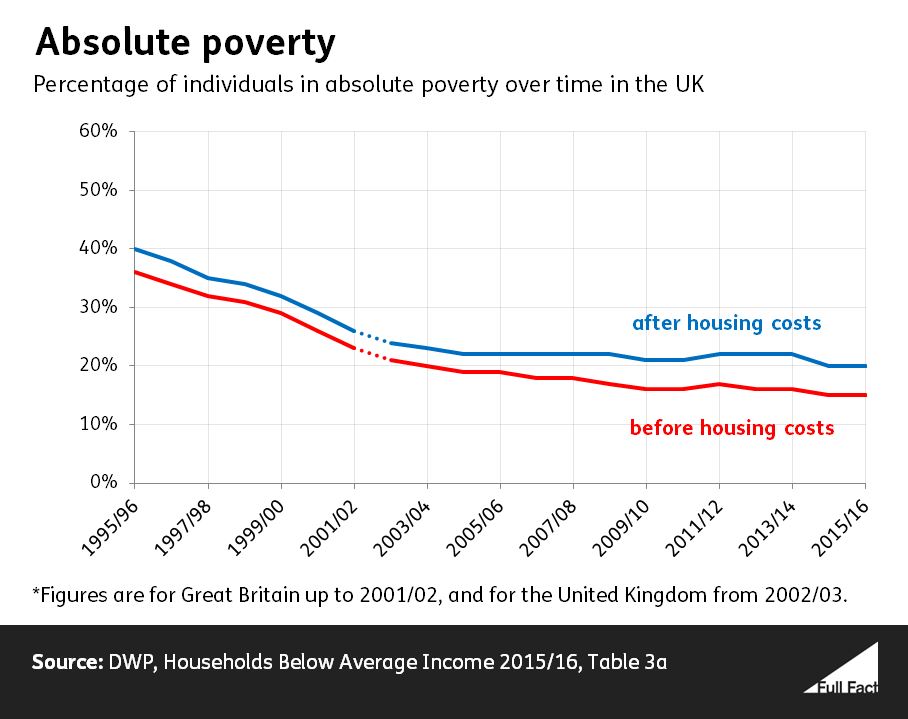
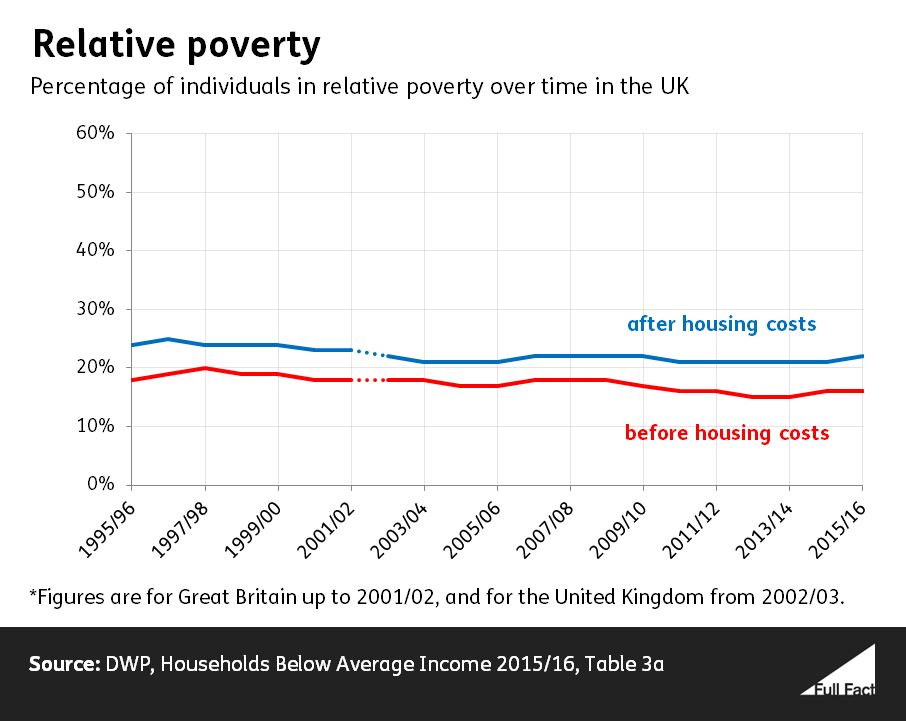
An estimated one in five people are living in absolute or relative poverty in the UK, once housing costs are taken into account—according to the latest figures for 2015/16. That’s around 13 million people in absolute poverty, and 14 million people in relative poverty.
Before housing costs, this falls to around one in seven living in absolute poverty, and one in six living in relative poverty.
You can read more on the different ways poverty is measured in our supercheck.
15% of people in the UK were in absolute poverty before housing costs in 2015/16. That’s 9 million people. 20%, or 13 million people, were in absolute poverty after housing costs.

Is social mobility in England still all about the North/South divide?
“Scarborough was in there and I think the education was highlighted in that report and that is why there is £72 million going towards specific areas in the country, of which Scarborough is one, to help really improve the quality of education.”
Sam Gyimah MP, 30 November 2017
The Social Mobility Commission published its fifth annual report this week. It says that when it comes to social mobility in England “There is no simple north/south divide. Instead, a divide exists between London (and its affluent commuter belt) and the rest of the country—London accounts for nearly two-thirds of all social mobility hotspots.”
A “hotspot” is an area with high social mobility, according to the report.
The best performing council area in England for social mobility was Westminster and the worst performing was West Somerset. In terms of regions, London was by far the best performing and the East Midlands was the worst.
Of the 32 council areas in London, the report classified 29 as “hotspots”. It attributes London’s dominance in the social mobility league tables to its economic strength.
The report also says that some of the worst performing areas of the country for social mobility are in rural areas rather than cities and some are also in “relatively affluent” parts of the country.
Scarborough was near the bottom of the list
Scarborough—where this week’s Question Time was held—was ranked 295 out of 324 local authorities for social mobility (when ranked from best to worst). The report described it as one of several “entrenched social mobility coldspots” and it was in the bottom ten local council areas for “school social mobility indicators”.
The government has said it will provide a share of £72 million to “Opportunity Areas”—12 regions in England that performed poorly for social mobility in last year’s report from the Commission. One of these areas is the North Yorkshire Coast, including Scarborough.
In North Yorkshire the government says the “Opportunity Areas” programme will involve improving early years education, supporting literacy and maths in the area and increasing the number of good secondary school places available.
Scotland and Wales
The report also looks at social mobility in Scotland and Wales, although because of differences between the way the statistics are collected in the three countries they can’t be compared to each other.
In Scotland social mobility was highest in “rural and semi-rural” areas. Former industrial areas Dundee, East Ayrshire and Clackmannanshire had the lowest social mobility.
In Wales there was no clear north/south divide, nor a clear contrast between city and rural residents.
Defining social mobility
The Social Mobility Commission says social mobility is “about ensuring that everyone has the opportunity to build a good life for themselves regardless of their family background.” So in the report an area with lots of social mobility would mean coming from a disadvantaged background wouldn’t hold a person back from achieving their potential.
The report looked at disadvantage in England and Wales based on whether or not a person was eligible for free school meals and then looking at various factors like how these people performed at school, whether or not they obtained a degree, and the kind of jobs and wages they went on the get.
The figures for Scotland focused on all people’s life changes, rather than specifically those from the most disadvantaged backgrounds.

