BBC Question Time, factchecked
Question Time this week was in Newcastle. On the panel were Shadow Foreign Secretary Emily Thornberry, Conservative MP Nadhim Zahawi, former Liberal Democrat leader Tim Farron, Spectator and Sun columnist Rod Liddle, and crime writer Val McDermid.
Is austerity linked to 120,000 unnecessary deaths?
“There was a report this week, we are getting 120,000 unnecessary deaths every year in this country as a direct result of the austerity.”
Val McDermid, 16 November 2017
A report by academics at University College London published this week found a link between restrictions on health and social care spending and an estimated 45,000 more deaths between 2010 and 2014 than there would have been had previous trends continued.
This is not an estimate of how many could have been avoided, the authors stressed. Nor is it an estimate of the amount of deaths every year.
While lower growth in health and social care spending since 2010 may be behind the increase in deaths, these findings should be treated with caution as the research doesn’t prove this is the case. Reduced spending is one of a number of possible explanations for the results.
Where does the 120,000 come from?
When the study began the authors only had official figures for the number of deaths up to 2014, so they projected what might happen to the number of deaths between 2015 and 2020.
Taking the 45,000 figure and adding it to the number of additional deaths they predicted between 2015 and 2017, they estimated that there were an “additional” 120,000 deaths between 2010 and 2017. Again, that’s compared to what would have been the case had previous trends continued.
What might be behind the ‘additional’ deaths?
To see if there is a link between health and social care spending and these additional deaths, the authors also looked at some other possible causes. These included changes in the economy (like unemployment and inflation) and changes in average weekly pensions. They also looked at the combined effect of spending and its impact on changes in health and social care staff and infrastructure.
Accounting for these things, the authors concluded that restrictions on spending and the number of nurses were linked with the 120,000 additional deaths.
Older people accounted for more of these additional deaths, with deaths at care homes and at home contributing most to the estimated additional deaths. Deaths in hospital were lower than expected. The authors put this down to greater pressures on social care spending, but also a drive to move more patients reaching the end of possible health treatments out of hospital.
While other academics have said the conclusions are “plausible” they have also stressed other possible explanations.
For example, Dr Richard Fordham, Senior Lecturer in Health Economics, University of East Anglia, has said: “...This is indeed a plausible hypothesis. But other explanations are available. Patient cohorts may have changed (for example more end-stage, longer-term illnesses); patients may have succumbed to different or new diseases (eg. MRSA, cirrhosis etc.); or had greater multiple morbidities (asthma plus diabetes plus cancer etc. ) than similar cohorts of the same age before them?”
Professor Martin Roland Emeritus Professor of Health Services Research, University of Cambridge said: “This study suggests that a change happened to cause deaths to stop declining around 2014. This is likely to be a correct finding. However, the link to health and social care spending is speculative as observational studies of this type can never prove cause and effect."
You can read their full comments here, published by the Science Media Centre, a press office for scientific commentary on the news.
Did 500,000 children need emergency food supplies last year?
“Half a million children last year went for three days' emergency food supplies.”
Emily Thornberry MP, 16 November 2017
437,000 three day emergency food supplies went to children in the year to March 2017, according to figures from the Trussell Trust—the UK’s largest network of food banks.
This measures the number of food parcels given out rather than the number of children receiving them. The Trussell Trust says on average, people who were referred to them used a food bank twice last year—which they told us included children’s use too. So this suggests that around 220,000 children may have used Trussell Trust food banks over this period.
The Trussell Trust’s latest figures cover the six months from April to September 2017. During this time 209,000 three day supplies were given to children.
None of these figures count use of food banks not run by the Trussell Trust. The Trussell Trust’s food banks are thought to roughly account for around two-thirds of the food banks in the UK.
We’ve looked into the reasons behind rising food bank use here.
Are nurses taking a second job to survive?
“A quarter of our nurses need a second job. Many of them have to go to food banks.”
Emily Thornberry MP, 16 November 2017
23% of respondents to a survey sent out to Royal College of Nursing (RCN) members said they had taken an additional job in the last year, such as agency nursing, to help pay everyday bills and living expenses. We don’t know how representative this is of all nurses, and this is based on a low response rate (8%).
Media reports show that at least some individual nurses and trainees have visited food banks and we’ve look at that in more detail here. We don’t have solid evidence of the scale of use.
A quarter of nurses responding to a survey said they had taken an additional job to pay the bills
A Royal College of Nursing employment survey released to the press this week found that 23% of respondents said they had “taken out an additional paid job” in the last year to meet daily bills and everyday living expenses.
The survey hasn’t been published, which is required for professional pollsters who are members of the British Polling Council. The RCN sent us a copy of the press release and initial findings. The questions can be found here.
The RCN told us the survey was sent out to 100,000 randomly selected members, out of their 435,000 members. Only 7,720 responded (8%).
According to the organisation that carried out the survey, the Institute for Employment Studies, these respondents had fairly similar demographics, educational levels and jobs to those of the RCN membership as a whole and so it can be said to be representative of the RCN’s membership—but we don’t have the full data to verify this.
If this is the case, then it increases the likelihood that the survey is representative of the RCN’s membership, but it’s still only a rough guide. The 8% who filled out the survey may still be different in ways that weren’t measured to the 92% who didn’t respond.
There are around 690,000 nurses and midwives registered with the Nursing and Midwifery Council (which nurses and midwives have to be registered with to work in the UK). The RCN doesn’t say the survey is representative of all nurses in the UK.
The Royal College of Nursing asked, “To meet your daily bills and EVERYDAY living expenses (rather than costs), have you done any of the following over the last year?”. 23% said they had “taken out an additional paid job”. The most common answer, selected by 50% of respondents, was “worked extra hours in your main job”.
Of those who said they took on an additional job, around half worked as a bank nurse, and 30% said they worked as agency nurses. Bank nurses are nurses that work covering other shifts when people are absent through sickness or on leave, or if a job is vacant.
Some nurses’ pay has reduced by between 7% and 11% since 2010
Nurses and health visitors working in hospitals and community health services in NHS England earned an average of £31,000 in the 12 months to June 2017. That figure is the same whether you look at their basic pay for a full-time equivalent post or the total average earnings per person.
It’s just slightly higher than the average for all NHS England staff working in hospitals and the community using the FTE measure and slightly lower using the total average earnings.
Averages aren’t always that helpful when looking at something like pay though as the experience can vary quite a lot from person to person.
Once qualified nurses start working in the NHS they begin at pay band 5. This means that the entry level salary for a nurse or midwife in NHS England was £22,128 in 2017/18.
Nurses at pay band 5 have seen their pay reduced by between 7% and 11% between 2010 and 2016. That’s once you account for inflation, according to the King’s Fund health think tank.
Is the EU becoming less important to the world economy?
"The EU currently represents just 15% of the world's economy and it’s forecast to go down to 12% by 2030."
Audience Member, BBC Question Time, 16 November 2017
There are two common ways of measuring the size of an economy. They give quite different estimates of the EU’s share of the world economy: 16% or 22%, as of October 2017.
Both measures show that the EU’s share of the world economy is declining and expected to continue doing so. One unofficial forecast estimates the EU’s share (excluding the United Kingdom) could be 12% by 2030.
There are two main measures of GDP
One way is to look at the value of a country’s economic output (GDP), and see what it’s worth in US dollars (USD).
Using market exchange rates has the advantage of being quite simple (it’s like the exchange rates you use when going on holiday), but they’re not consistent over time. A country’s share of world GDP can move up or down quite suddenly if exchange rates change.
For instance, just because the UK sterling exchange rate fell suddenly on 24 June 2016 doesn’t mean that the UK’s economic output suddenly got smaller, even though it was worth less in US dollars.
So an alternative is to calculate GDP in terms of ‘Purchasing Power Parity’ (PPP).
This adjusts the figures to reflect different price levels around the world, and to account for how currency values have changed over time.
That solves the problems with the market exchange rates approach, but creates new ones too. One issue is that it involves many more assumptions and has the potential for errors.
The EU’s estimated share of world GDP is currently 16% or 22%
Looked at in terms of PPP, the EU’s share of world GDP in 2017 is around 16%, according to figures from the IMF. This measure includes the United Kingdom in the EU. Without the UK, the EU’s share would be roughly 14%.
This measure also shows that the EU’s share of the world economy has been steadily declining over time. It was 30% in 1980 and is expected to be 15% by 2022.
These historic figures include all states who are members of the EU today. So for example, although Spain and Portugal only became members later in the 1980s, the EU share of world GDP figure for 1980 includes their economies, as they are members today.
The IMF also has figures based on USD. This measure puts the EU’s share of world GDP at 22%.
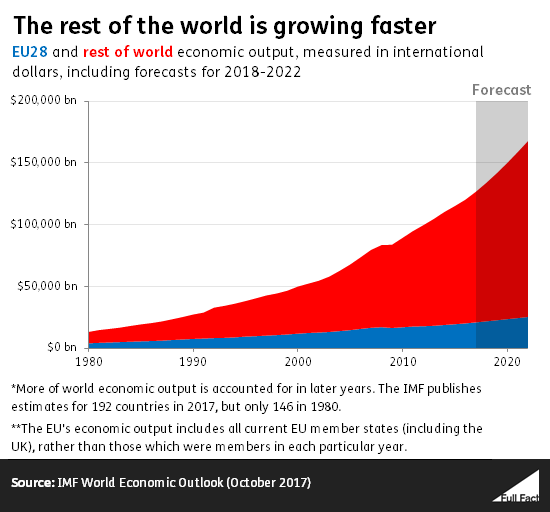
It shows a similar trend of the EU’s share declining over time – from 34% in 1980 to an expected 20% by 2022.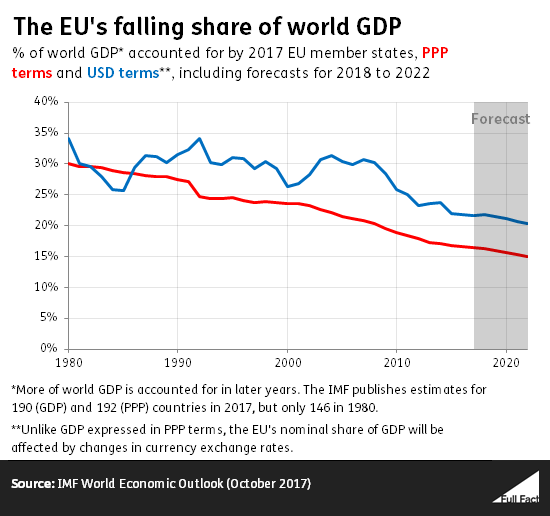 This is not because the EU’s GDP is getting smaller (it has risen consistently over time). However, the rest of the world has grown faster.
It’s also likely that estimates for earlier years over-estimate the EU’s share of world GDP as only 146 countries were accounted for in 1980, compared to 190 for GDP estimates and 192 for PPP estimates in 2017.
Falling further by 2030
Estimates to 2030 and beyond were published by accounting firm PwC earlier this year, based on its own analysis.
Its estimates suggest that by 2030, the EU’s share of the global economy could be around 12%, based on PPP figures. This estimate assumes that the UK will not be a part of the EU then.
Is unemployment the lowest it has been since 1975?
“The employment figures were excellent this week. The lowest unemployment since 1975.”
Nadhim Zahawi MP, 16 November 2017
There were 1.42 million adults unemployed in the UK in the summer of 2017. That’s 4.3% of people aged 16 or over classed as economically active—those either in work or looking for work.
It’s correct that the last time the unemployment rate was this low was in 1975.
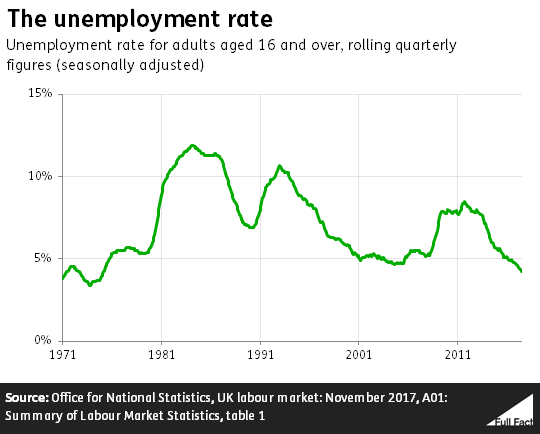
The unemployment rate varies for different groups of people. For example, the unemployment rate for men is the same as the UK-wide total—4.3% and the lowest since 1975. For women it’s even lower, 4.2% and the joint-lowest it has been since records began in 1971.
11.9% of 16 to 24 year olds (either in work or looking for it) were unemployed during the same period. That figure includes full-time students looking for part-time work. It’s also the lowest it has been since 2004.
Unemployment measures people without a job who have been actively seeking work within the last four weeks and are available to start work within the next two weeks, or who have found a job and are waiting to start in the next two weeks.
These figures don’t tell us anything about “underemployment”. That’s the number of people seeking more hours, working no more than the maximum weekly working hours already, and able to work more within the next two weeks. We’ve written about this before here.