BBC Question Time: factchecked
This week Question Time was in King's Lynn. On the panel were former secretary of state for international development Priti Patel MP, Lisa Nandy MP, leader of the SNP at Westminster Ian Blackford MP, CEO of Mansfield Town Football Club Carolyn Radford, and columnist for The Times and Spectator Matthew Parris. We factchecked claims on councils' spending on social care, the link between universal credit and food bank usage, how the NHS is funded, and NHS spending and satisfaction.
Councils aren’t getting enough funding to meet demand for social care
“[Local authorities] are bringing in less money in council tax at the moment than they're spending out just in vulnerable adult and children care alone.”
Lisa Nandy MP, 5 July 2017
Ms Nandy directed us to this report by the Local Government Association (LGA), which reports that council tax revenues raised in England in 2017/18 were £500 million less than the adult and children’s social care budget for councils in the same year.
This claim is certainly in the right ballpark, but we we haven’t been able to replicate the figure exactly. While the LGA says more was spent on social care, government data suggests that £5 billion more was raised in council tax last year in England than councils spent on social care for children and adults. We’ve asked the LGA for more information.
Either way, councils’ abilities to fund social care relies on more than council tax revenues—which account for around 30% of council funding in 2018/19. The single largest source of income is government grants (50%). Whilst council tax revenues are rising year-on-year, central government funding has fallen.
Adult and children’s social care will cost councils £25 billion this year
Adult social care is the support provided to adults with physical or learning disabilities, or physical or mental illnesses. This could be for personal care (such as eating, washing, or getting dressed) or for domestic routines (such as cleaning or going to the shops). You can read more about it here. Children’s social care provides support to vulnerable young people.
There are 152 councils in England responsible for providing social care to their residents. They budgeted around £16 billion to spend on adult social care in 2018/19, and around £9 billion for children’s social care (that’s a net figure, accounting for any income they receive for the specific service).
The budget for this year amounts to a 7% spending increase in children’s social care, and a 3% increase in adult social care. These are the biggest spending increases of any council services listed in the government’s annual financing report. Overall, adult and children’s social care amounts to 27% of councils total planned spend on services in 2018/19.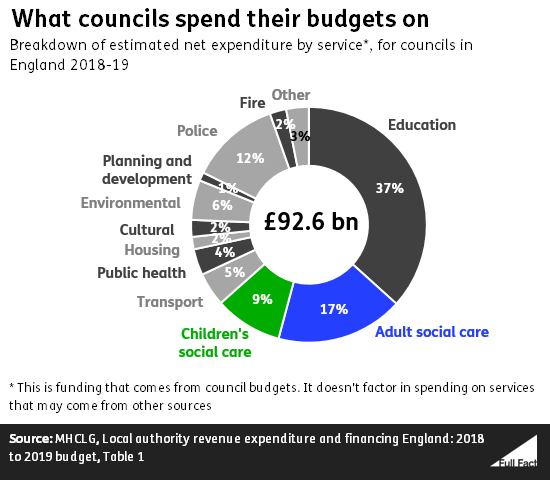
Around £30 billion will be raised through council tax this year
Councils in England expect around £30 billion to be raised through council tax this year. Last year they collected £28 billion in council tax (though not all of this money was necessarily owed that year). The LGA says council tax revenues were £23 billion last year. We’ve asked the LGA for more information.
Councils have other sources of money
Council tax isn’t the main source of income for local councils. The money councils have to spend on all the services and functions they provide comes from three main sources: council tax, business rates and money directly from the government.
In 2018/19, around 30% of council funding is expected to be raised through council tax (including the other precepts charged in a council tax bill). The single largest source of income is government grants (50%).
Council tax is set in order to help councils meet their annual budget for the year.
Council tax isn’t rising fast enough to keep up with social care demand
In February this year, 71% of councils planned to increase general council tax by 2.95% in 2018/19, according to the Local Government Association.
The 152 local authorities responsible for providing social care can charge a “precept” on your council tax bill to help pay for adult social care (up to 6% of the cost of your core council tax payment). In February the LGA reported that 147 out of 152 local authorities were considering or had approved some level of precept for 2018/19, raising £548 million through it.
The LGA argues that these rises in council tax and precepts are not enough to meet the cost of providing social care. In particular, they point to a drop in central government funding.
They say that councils will “have to continue to divert ever-dwindling resources from other local services, including filling potholes, maintaining our parks and green spaces and running children’s centres, leisure centres and libraries, to try and plug growing funding gaps in adult social care, children’s services and homelessness support.”
The Institute for Fiscal Studies says that council spending on adult social care in particular has been protected relative to spending on other services. It also says that the financial demand for adult social care is going to increase over time. Based on a 4.4% predicted increase in real-terms council tax and business rate revenues, it expects that adult social care will account for half of council revenues by 2035, compared to less than one third today.
It also says that there may be a ‘distributional’ issue—some councils could have a much higher demand for social care services than others, depending on the population.
Is Universal Credit driving people to food banks?
“The Trussell Trust have told us that in areas where Universal Credit has been rolled out over a 12 month period that food bank use has increased by 52%.”
Ian Blackford MP, 5 July 2018
This is correct according to the Trust’s own research.
This doesn’t prove that Universal Credit has caused an increase on this scale, and the Trussell Trust itself says it isn’t the only benefit people at food banks are experiencing issues with. There’s wider evidence that people have had problems during the rollout of Universal Credit and that some have been going to food banks as a result.
Universal Credit is a new working-age benefit that is replacing a lot of existing social security benefits like income-based Jobseeker’s Allowance and Housing Benefit. It’s currently being rolled out in stages across different parts of the UK, and all existing claimants of the old benefits are expected to be moved to the new system by 2022.
Concerns have been raised that delays in moving claimants over to Universal Credit or administration problems may be causing some people to use food banks. The Trussell Trust is the UK’s largest network of food banks.
Research shows a correlation between increased food bank use and early rollout areas for Universal Credit
The Trussell Trust confirmed to us from its own research that: “analysis of 38 foodbanks in our network that have been in full Universal Credit rollout areas for a year or more shows that these projects experienced an increase of 52% in the twelve months following the full rollout date in their area.”
The Trust said it added up data from individual food banks in areas of the UK where Universal Credit had been rolled out and compared the change in usage after a year. The average increase was 52%.
Meanwhile using a random sample of 247 food banks in areas without Universal Credit, or those where the rollout had only just started (for at most three months) the average increase was 13% over equivalent periods. We don’t know how these averages vary across different food banks.
The National Audit Office has observed separately steeper increases in food bank use in three of the four areas it looked at where Universal Credit is being introduced.
As we’ve looked into before, it’s as important to know what food bank figures don’t tell us as what they do.
The Trussell Trust doesn’t run all food banks in the UK, for instance, so these findings are specific to the cases they’ve been able to measure.
This is also still early days. We know that—by definition—the rollout areas covered in the study are among the earliest to receive Universal Credit. The benefit is currently claimed by an estimated 920,000 claimants and is expected to reach over eight million in total.
We don’t know exactly how much of an impact Universal Credit is having on food bank use, but it isn’t the only factor
The research showing a 52% increase can’t on its own prove that Universal Credit is the main driver of increased food bank use, though it’s still likely to be a major factor.
The Trussell Trust has done wider work asking some of its users about their experience of Universal Credit and why it led them to use a food bank. This gives an insight into the problems some people are facing, and why they went to a food bank. But it isn’t necessarily a representative sample of Trussell Trust food bank users as a whole, which the Department for Work and Pensions has drawn attention to.
The evidence from its referral agencies suggests in 2017/18 a growing proportion of referrals to food banks are because benefit payments aren’t seen to be covering the costs of essentials.
28% of referrals for which the Trust has data were due to ‘low income’—for which benefits were a significant factor—followed by benefit delays (24%) and benefit changes (18%).
As the Trussell Trust also points out: “Universal Credit is not the only benefit people at food banks are experiencing issues with”. Research has also suggested people on disability benefits are more likely to visit food banks.
These figures won’t reflect the full impact of recent changes
The Department for Work and Pensions told us: “The reasons why people use food banks are complex, so it’s wrong to link a rise to any one cause”. It went on to say “Universal Credit is working for the vast majority who claim it”.
The DWP also points out that the research, covering 2017/18, won’t reflect the impact of all of the changes introduced earlier this year to provide extra support to claimants and allowing access to a full month’s advance payment while waiting for an award. We won’t know what effect these have had until more research has been done and those changes have had time to bed down.
The DWP’s own research shows that significant numbers of claimants report experiencing financial difficulties.
It told us that 83% of claimants are satisfied with the service they receive, which is correct for people on the ‘live service’—a temporary part of the rollout in some areas that has more restrictions on who can claim, as opposed to the ‘full service’.
But as the National Audit Office drew attention to this week in an argument with the Secretary of State, it’s also the case from the DWP’s research that 40% of claimants on the ‘full service’ surveyed report experiencing significant financial difficulties eight to nine months into their claim.
How is the NHS funded?
“In terms of general taxation, we pay for the NHS through our taxes and that will always continue.”
Priti Patel MP, 5 July 2018
In 2017/18, around £110 billion was spent on the NHS England budget. Including things like hospitals, public health initiatives, education training and IT, the cost was £125 billion.
This is paid for mainly through general taxation, and National Insurance contributions from employees, employers and the self-employed.
General taxation funds about 80% of the budget, and National Insurance contributions cover most of the rest. Total NI contributions to the NHS in 2017/18 were estimated to be just under £24 billion, which is just under 20% of the total budget.
A small amount of cash is generated by patient charges, like those for prescriptions and dental care, which were introduced in the 1950s. In 2016/17, £555 million was charged for prescriptions in England. In total, £1.6 billion was collected in patient charges in 2016/17.
In Scotland, Wales and Northern Ireland, there are no charges for prescriptions. Health is a devolved matter, so these governments decide how much to spend on health from the block grant they receive from central government.
National insurance contributions became a much bigger part of the contribution to health spending in 2003 (from 12% in 2002 to 20%) when rates of contribution were increased to accommodate proposed increases to health spending.
Theresa May announced recently that the NHS in England would get a real terms funding increase of just over £20 billion by 2023/24. She said this was a 3.4% annual increase, accounting for inflation.
She said part of this would come from a “Brexit dividend”, although extra money following ceasing payments to the EU are not guaranteed. She also said that “taxpayers will have to contribute a bit more in a fair and balanced way to support the NHS”, implying some of it would come from taxation. You can read more about how this increase might be funded in our factcheck.
Satisfaction with the NHS peaked in 2010
“Under the last Labour government, we had the longest sustained period of investment in the NHS since it was founded and by the end of the period we had the highest satisfaction levels since it was founded.”
BBC Question Time audience member, 5 July 2018
What did Labour spend on the NHS?
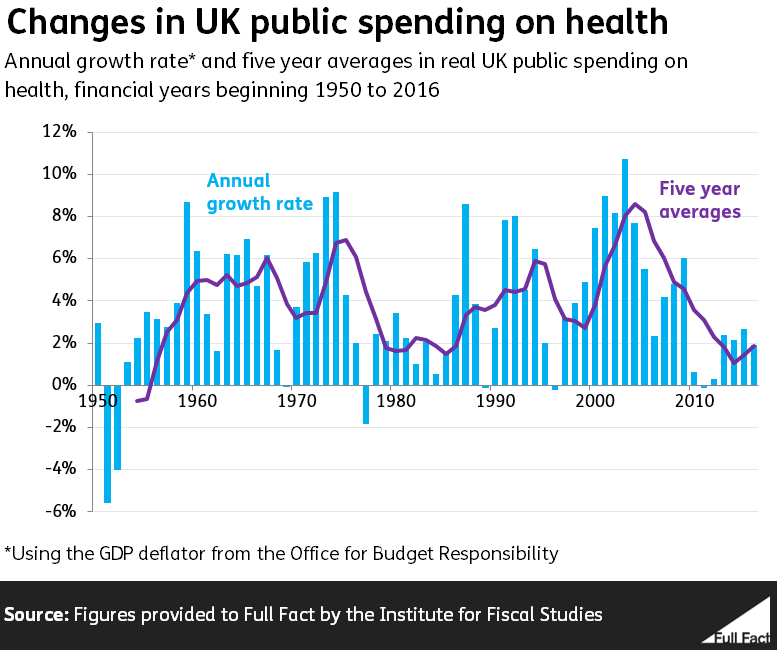
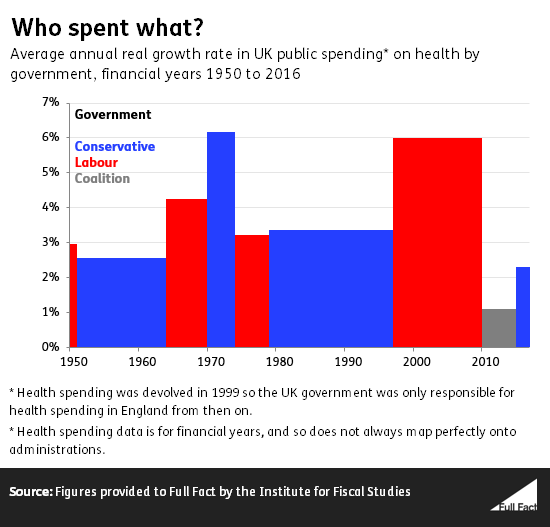
From 1997 to 2010 spending increased in real terms by 6% a year on average, the second highest average under one party in continuous government since 1950. The highest was 6.2% a year averaged under the Conservative government from 1970-1974.
The longest sustained period of increases in public spending on health in the UK was from 1953-1969 (that’s counting from 1950—the earliest figures we have), when a number of Conservative and Labour governments increased the spending on health in real terms every year. The majority of this money, though not all of it, was spent on the NHS.
From 1999 health spending was devolved, and so the UK Labour government was only responsible for spending in England.
How satisfied are people with the NHS?
The British Social Attitudes Survey has asked the public since 1983 about their satisfaction with the NHS. From 2001-2010 the proportion of people in great Britain surveyed reporting satisfaction with the NHS generally increased to a peak of 70%.
That figure was from the 2010 survey, which took place between June and September, after the Coalition government had taken office. By 2017 satisfaction had fallen to 57%.
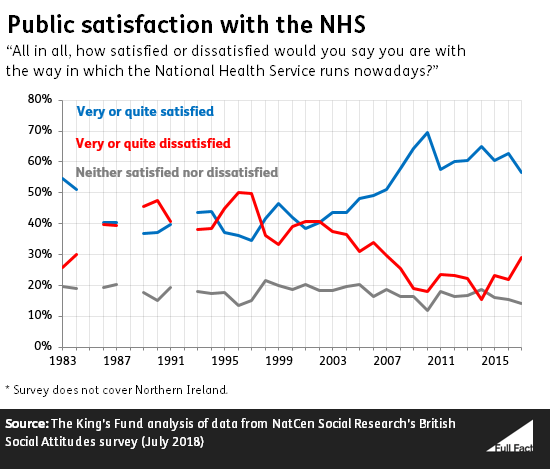
The measure only goes back to 1983, so we can’t say that 70% was the highest satisfaction level since the NHS was founded back in 1948. The survey doesn’t cover Northern Ireland.
The King’s Fund says that “public satisfaction cannot be interpreted as a straightforward indicator of NHS performance”. It says that “the relatively high levels of satisfaction reported in 2015 in part reflect positive views on the quality and range of services available on the NHS, but also reflect public support for the concept of a publicly run health service free at the point of use and providing a comprehensive range of services.”