What was claimed
Youth unemployment is down 44% since 2010.
Our verdict
Correct.
Youth unemployment is down 44% since 2010.
Correct.
“Youth unemployment down 44.2%”
Young Conservatives, 17 July 2018
It’s correct that youth unemployment in the UK—in this case people aged 16-24, is down by 44% since 2010, when the Coalition government entered office. That’s about the same fall as seen across employment of all age groups.
Just before the 2010 general election there were an estimated 940,000 young people unemployed. That reached over a million in 2011 and 2012, before falling back to today’s estimate of about 520,000. That’s roughly a return to the levels last seen in the early 2000s.
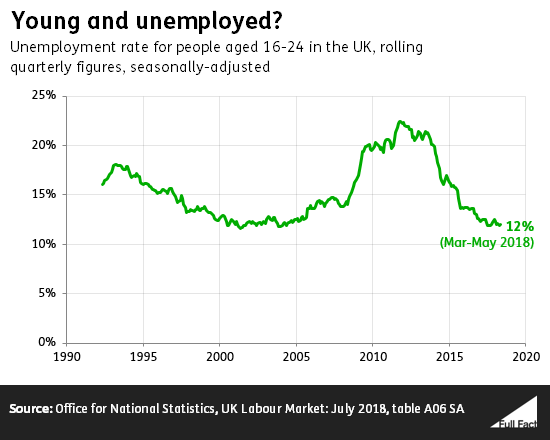
The unemployment rate measures the proportion of people in the jobs market who don’t have one, so it doesn’t count people who aren’t actively seeking work. For people aged 16-24, the unemployment rate has also fallen from 20% at the 2010 election to 12% now.
Honesty in public debate matters
You can help us take action – and get our regular free email
Plenty of young people aren’t even in the jobs market, usually because they’re in full time education, and they aren’t counted against the unemployment rate.
You can still be employed if you’re in full time education and you do part time work, although most students don’t.
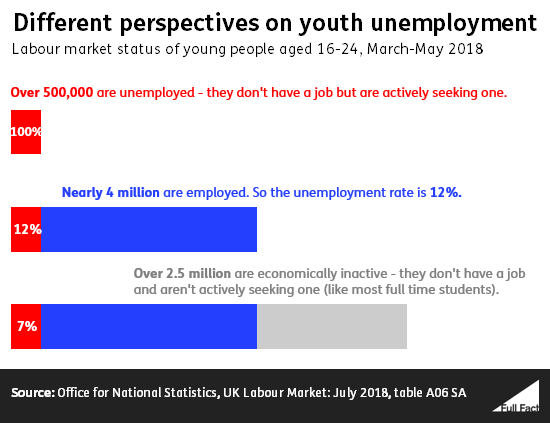
Out of all young people, 55% are employed, 7% are unemployed and 38% are economically inactive (neither in work nor actively seeking it).
Young people are more likely than most to be working part time or in temporary employment, or on a zero-hours contract. That said, the majority of young people aged 16-24 in work have a full time job.
Some comments in response to the claim on Twitter say it hides the fact that more young people are staying on in education, so not counting towards the unemployment figures.
This isn’t a fair criticism of the situation since 2010, where there hasn't been much movement in the education trends, so the fall in unemployment is genuine.
But there is a point here about the longer term. The recession in the late 2000s corresponded with an increase in the proportion of young people in full time education, and the proportion who are economically inactive. Those increases accelerated long-term trends in both measures.
Even though the jobs market has recovered since then, those figures haven’t returned to pre-recession levels.
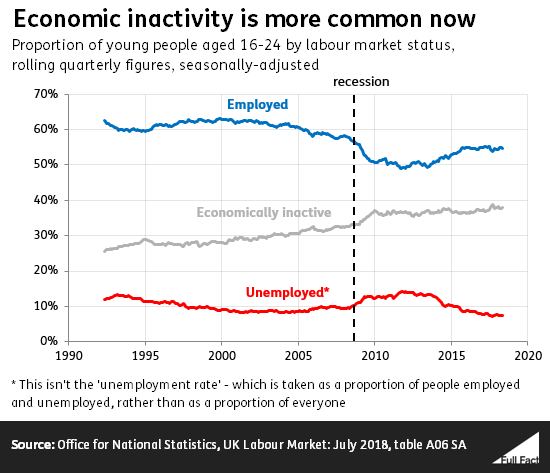
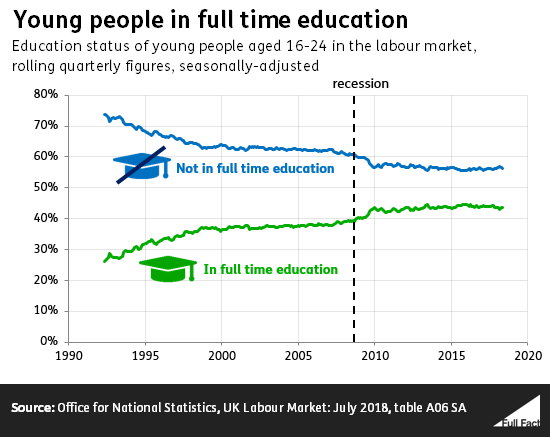
The proportion of young people aged 16-24 who are economically inactive is at near record levels, as is the proportion in full-time education.
So the employment figures have been heading in a positive direction, but we haven’t returned to quite the same jobs market we used to have.
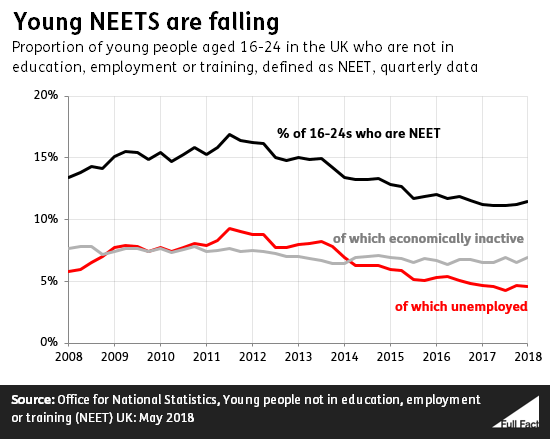
A NEET is someone not in education, employment or training. Education and training include apprenticeships, government work programmes, people who’ve recently finished job-related training and people enrolled on an education course and are waiting to start or for term to restart.
So these figures, broadly, give us a sense of how many young people aren’t involved in the jobs market and aren’t studying or training towards one.
They also show a positive direction since 2010 from the government’s perspective. The number of young people aged 16-24 classed as NEET fell from over a million to 800,000 now, or from about 15% of all 16-24 year olds in 2010 to 11% now.
But NEETS also look a little different than they used to.
In 2010, young people who were NEET were more likely to be actively seeking work (“unemployed”) than economically inactive. That picture has now reversed.
Figures from the ONS suggest young people who are economically inactive and NEET are usually looking after a family home, or are long-term sick or disabled.
Full Fact fights for good, reliable information in the media, online, and in politics.
Bad information ruins lives. It promotes hate, damages people’s health, and hurts democracy. You deserve better.