What’s happening to rented social housing in England?
Social housing is low cost rented housing and low cost home ownership for people who may not be able to access the private market. It includes council housing and homes provided by housing associations. In this piece we’ll be focusing on rented accommodation available in the social housing sector.
Housing is a devolved issue so the UK government only has responsibility for England, and statistics for Scotland, Wales and Northern Ireland are published separately.
Honesty in public debate matters
You can help us take action – and get our regular free email
The amount of social housing for rent is slowly rising
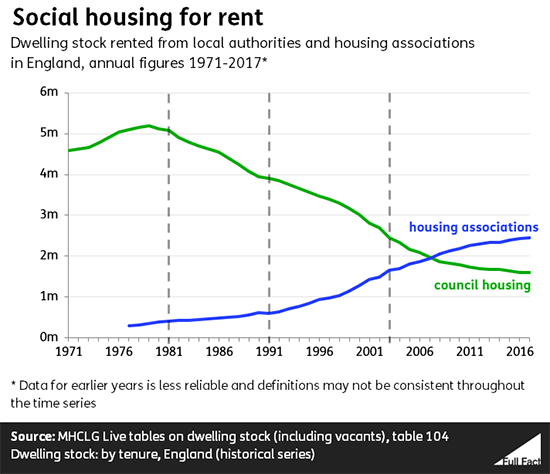
Over four million homes were rented from councils or housing associations in 2017. Of these, 1.6 million were council homes and 2.4 million were from housing associations.
The amount of social housing for rent fell from the peak of around five million in the early 1980s to just under four million in the mid-2000s, but it has been slowly rising since.
This has mainly been driven by an increase in housing association homes. The proportion of all social housing provided by councils has generally been falling since the 1980s.
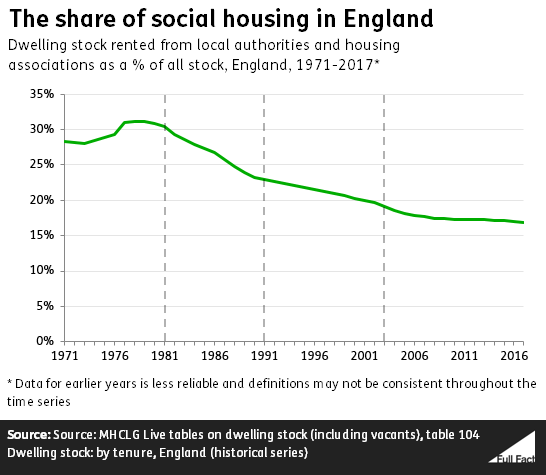
Homes for rent from councils and housing associations made up 17% of all homes (including owner-occupied homes) in 2017.
New social homes are more likely to be at the higher end of affordable rents
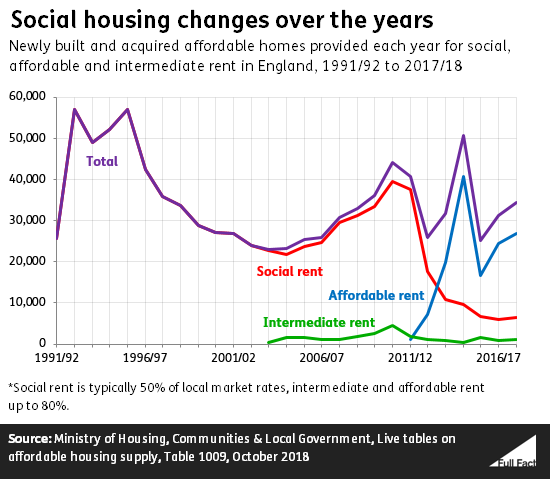
Around 5,000 new homes were built for social rent in England in 2017/18, and another 1,000 or so were bought or converted. These “social rent” levels are around 50% of market prices.
There were another 24,000 newly built homes for affordable rent and around 2,000 bought or converted. Affordable rent is subject to controls that make it around 80% of local market rent. The government includes “affordable rent” homes in its definition of social housing.
The number of new properties at affordable rent level has outstripped the number of new homes at social rent levels since 2013/14. However, most new lettings are still at social rents.
 There are also a small number of homes built or acquired for intermediate rent, which are available at “above social rent, but below market levels”, according to the House of Commons library. Homes available for intermediate rent are counted in the government’s definition of affordable homes.
Less than one percent of social housing was sold in 2016/17
Social housing is sold in several ways. The Right to Buy scheme for council housing is perhaps the most well-known, and there are similar schemes for tenants buying their home from housing associations.
Right to Buy schemes give some tenants who have lived in a council or housing association home for a number of years the right to buy their home at a discount.
Over 16,000 homes were sold under Right to Buy schemes in 2017/18. That’s 11% fewer than the year before, and well below the peak of 167,000 in 1982/83.
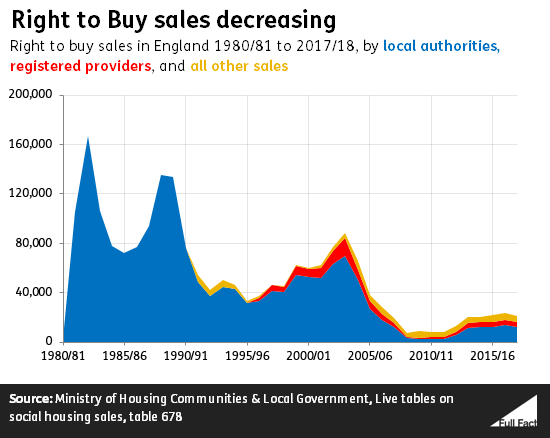
In 2017/18 there were also around 5,000 other types of social housing sales. This brought total sales to nearly 21,000.
The Right to Buy one-for-one replacement target isn’t being met
When the government increased the discounts available through Right to Buy in 2012 they committed to one-for-one replacement of all the additional homes this policy sold within three years of the sale. That target isn’t being met.
The government calculated that around 21,000 extra homes were sold between April-June 2012 and the same period in 2015. Meanwhile only about 19,000 have been built or bought by local authorities since 2012.
Housing association rents are higher than what councils charge
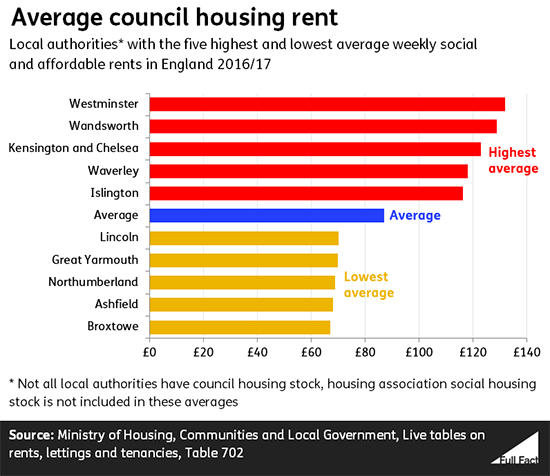
The average weekly rent for council housing across England was about £87 in 2016/17. That figure includes both social rents and the higher affordable rents.
The most expensive average annual council house rent was in Westminster (£132 a week), the cheapest was Broxtowe, in Nottinghamshire (£67 a week).
In social housing provided by housing associations the average weekly rent was around £97 in March 2017.
Within these averages there is wide variation across the country. The highest was almost £140 per week in Newham, London, and the lowest (£73 per week) was in County Durham.
Another measure of average rents comes from the English Housing Survey. The median social renter paid £96 per week in 2016/17, while the median private renter paid £156 per week. ‘Median’ means that if we lined everyone up in order from those paying the highest to the lowest rent, the median renter would be stood in the middle.
More social housing is passing the decent homes test
There are four official criteria for a “decent home”:
- It meets the current statutory minimum standard for housing.
- It is in a reasonable state of repair.
- It has reasonably modern facilities and services.
- It has efficient heating and insulation.
There are two ways of measuring how many homes are decent: from information supplied by social housing landlords and by looking at what people tell a survey. Although both give different figures for the proportion of homes that aren’t in a decent condition, they show a similar trend.
Looking at all types of social homes the percentage that don’t qualify as decent homes has been falling since 2008. According to data supplied by councils and housing associations, the share of their homes that fail has fallen from 38% in 2002 to 2% in 2017.
The English Housing Survey, which inspects a sample of all homes, found 27% of social housing wasn’t of decent quality in 2008, falling to 13% in 2016.