Have patient waiting times increased by 6 per cent?
"PM's election pledge in jeopardy as report reveals patients waiting 6% longer and fewer receiving planned operations."
The Guardian, 19 April 2012
Last week both the Guardian and the Telegraph reported that NHS waiting times had increased by 6 per cent and that the number of operations had fallen.
However rather than relying upon official statistics, both newspapers were referring to research conducted by the Patient's Association. So what does it show?
Analysis
The figures mentioned in both the Telegraph and the Guardian are taken from a report produced by the Patients Association, 'The Waiting Game: The results of Patients Association into elective surgical procedures'.
In order to conduct an "independent study", The Patients Association sent out a Freedom of Information request to 150 acute trusts asking them for data on the number of procedures carried out and waiting times for 9 different procedures: hip, knee, hernia, tonsillectomy, adenoid, gallstone, hysterectomy and cataract operations. They also asked for data on bariatric surgery but these results were excluded from the report due to insufficient data.
These particular elective procedures were chosen as they were:
"identified from the helpline research database and verbal communications with clinicians and patients to be most likely affected following reorganisations."
Of the 150 FoI requests sent only 93 acute trusts responded with data for both 2010 and 2011. Not all of these 93 provided the exact figures that were requested and therefore the Patients Association analysed what figures were available. So for example, cataract waiting times data is extrpolated from the 71 trusts which provided a response.
Both the Telegraph and the Guardian reported that the number of procedures had fallen by 18,268 between 2010 and 2011. A graph representing the changes in the number of procedures can be found below
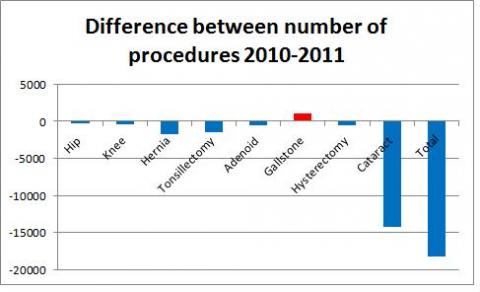
Both the Guardian and the Telegraph were accurate when they said that the number of procedures dropped by 18,268 between 2010 and 2011. However, as you can see from this graph the majority of this fall can be explained by the fall in the number of cataract procedures in this period, 14,267. Without cataract procedures the fall in the number of procedures is only 4,001.
It is not surprising that a drop in cataract procedures has such a large impact on the figures as they account for a large proportion of the number of procedures conducted in 2011: 175,731 of 382,465 mentioned in the report.
Both papers reported that waiting times had increased by 6 per cent between 2010 and 2011. This figure can be found in table 4 of the Association's report. The changes in waiting times can be seen in the graphs below:
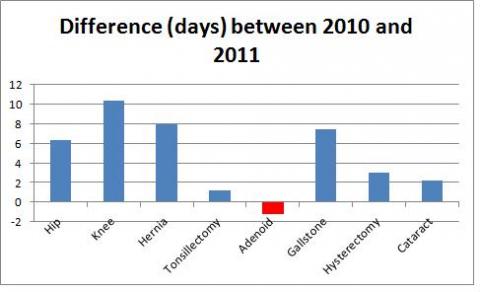
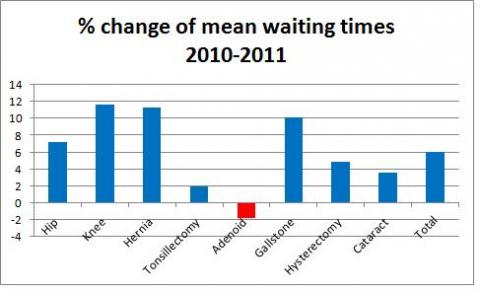
As you can see waiting times did increase by 6 per cent between 2010 and 2011. In 7 out of 8 procedures there was an increase in waiting times: people had to wait 6.3 days longer for a hip operation 1.2 days longer for a tonsillectomy and there was an 11.6 per cent increase in waiting times for knee operations. Only in adenoid procedures did waiting times fall, by 1.8 per cent.
So how do the Patients Association figures compare to official NHS statistics? These sort of comparisons prove problematic.
Firstly, the NHS has more than one measurement of waiting times, as mentioned in a previous factcheck. The NHS uses three different indicators of waiting times: the median time taken (measured in weeks) for a procedure to be completed, the time it takes for the longest-suffering 5 per cent to wait for treatment (measured in weeks) and the proportion of patients seen within 18 weeks.
The Patients Association data would be most similar to the median measurement used by the NHS. However, the Patients Association has measured the mean waiting time, not the median, and measures waiting time in days not weeks.
On top of these initial problems the Association only collected figures on 8 different procedures carried out at a maximum of 93 acute trusts. They thus did not use any information from foundation trusts which can also manage hospitals.
While the Patients Association show that waiting times have increased by 6 per cent, the NHS figures tell a different story. NHS figures for 2010 and 2011 can be seen on the graph below:

Based on the median wait (in weeks) waiting times have actually fallen by 0.6 per cent. However measured by the the 95th percentile waiting times have risen by 9.9 per cent while the proportion of patients being seen within 18 weeks has also fallen.
This might suggest that the Patients Association figures are not unrealistic, but as mentioned they are not directly comparable.
Conclusion
Both the Guardian and the Times accurately reported the findings to the Patients Association. According to this report between 2010 to 2011 waiting times have increased by 6 per cent while the number of procedures conducted has decreased.
The problem with the survey is that it is not comparable with official NHS statistics: the Association's report uses a relatively small sample and looks at only 8 different procedures.