“5 years into last Labour gov, NHS Satisfaction 41%
Dissatisfaction 40%
7 years into Tory gov
Satisfaction 63%
Dissatisfaction 20%
#NHSCrisis”
Guido Fawkes, 7 January 2017
It’s correct that public satisfaction with the NHS is higher now than it was in 2002, five years into the last Labour government.
But public satisfaction went up under that administration, looking across the whole of the party's last term in office. It’s remained about the same under the Conservatives.
And if you’re interested in the challenges facing the NHS in the winter of 2017, this survey from 2015 isn’t necessarily the best indicator of how the NHS is doing anyway.
We should also point out that the second set of figures quoted in the tweet we’re factchecking is out by a few percentage points, an error that flatters the government.
Honesty in public debate matters
You can help us take action – and get our regular free email
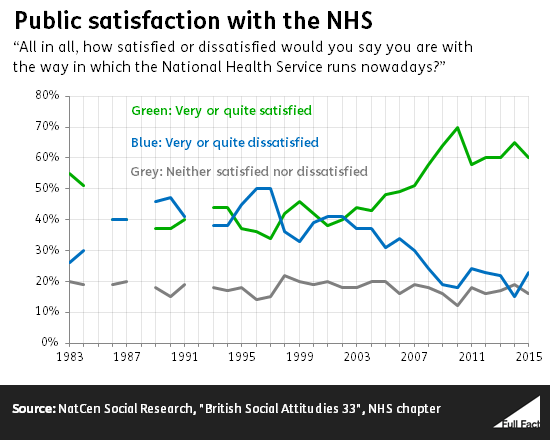
NHS satisfaction improved over the course of the last decade
The Guido Fawkes website sourced these figures from health think tank The King’s Fund, which took them from the annual British Social Attitudes survey carried out by NatCen Social Research. It's been asking the question "all in all, how satisfied or dissatisfied would you say you are with the way in which the National Health Service runs nowadays?” since 1983.
The latest data available is from 2015: so five rather than (as claimed) seven years into a Conservative government, and not directly related to public debate about the state of the NHS in the winter of 2017.
The percentage of respondents expressing themselves “very satisfied” or “quite satisfied” with the NHS in 2002 was 40%, while 41% were quite or very dissatisfied.
In 2015, the latest year for which data is available, 60% said that they were satisfied and 23% were dissatisfied. The claim above says 63% satisfied and 20% dissatisfied for 2015, which is three percentage points off in each case.
As is apparent from those figures, satisfaction is significantly higher in 2015 than in 2002. As the NatCen researchers comment, “levels of dissatisfaction with the NHS are comparatively low and remain relatively stable, despite reductions in funding since 2010”.
But there’s more to the story than this. For instance, the proportion of people unhappy with the NHS “declined from 50% in 1997 and levelled off between 2010 and 2015”.
 The King’s Fund also points out that “public satisfaction cannot be interpreted as a straightforward indicator of NHS performance”. It thinks that some people use the question to express political support for the NHS as an institution, rather than thinking about the standard of medical treatment on offer.
Or as The King’s Fund puts it, “the relatively high levels of satisfaction reported in 2015 in part reflect positive views on the quality and range of services available on the NHS, but also reflect public support for the concept of a publicly run health service free at the point of use and providing a comprehensive range of services”.