What was claimed
The number of new Covid-19 cases each day is roughly doubling every week.
Our verdict
This comes from the faster end of a range of estimates.
The number of new Covid-19 cases each day is roughly doubling every week.
This comes from the faster end of a range of estimates.
On Monday 21 September, the Chief Scientific Advisor, Sir Patrick Vallance, and the Chief Medical Officer, Professor Chris Whitty, gave a public briefing on Covid-19 in the UK.
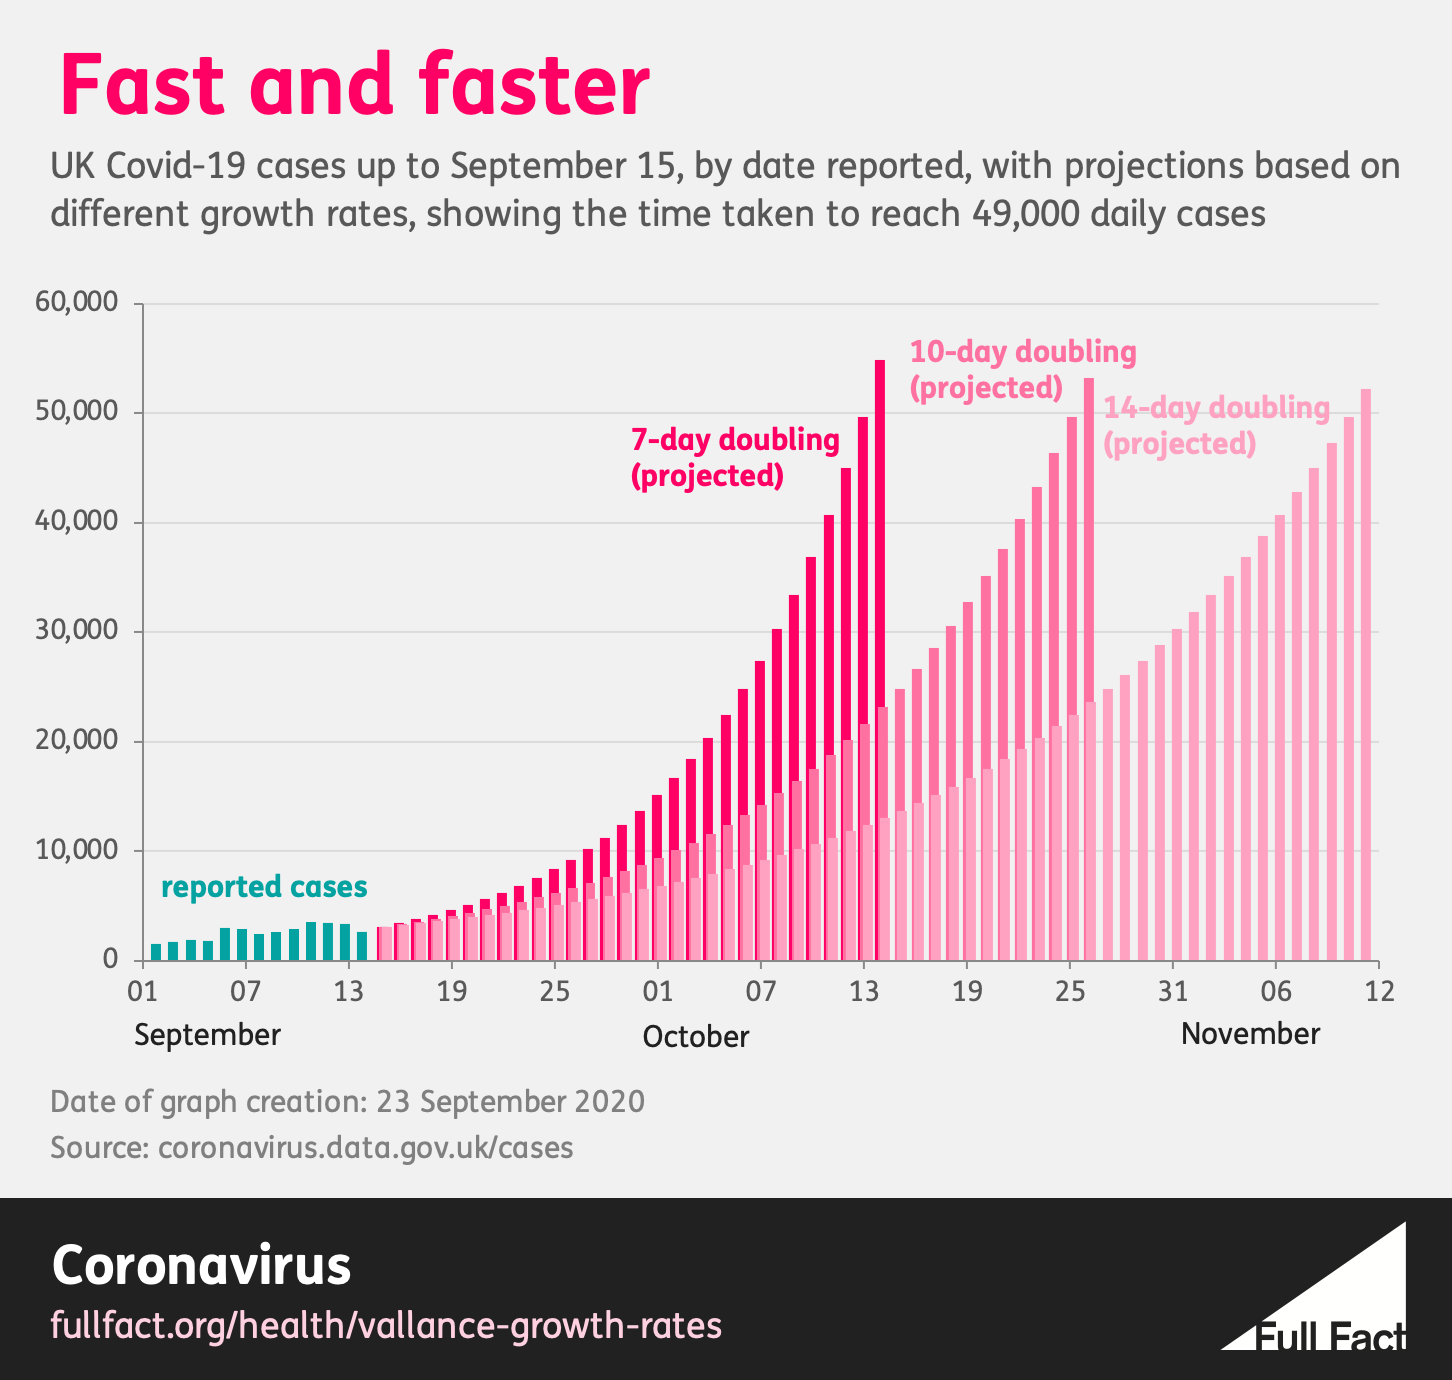
During the briefing, Sir Patrick presented a chart showing the number of new cases reported each day up to 15 September, with an illustration of what would happen in future if the number doubled every week, which was their estimate of the current trend. Ultimately this would reach 49,000 new cases on 13 October. Sir Patrick said, “[the chart] is not a prediction, but it is a way of thinking about how quickly this can change.”
However, some people have claimed that Sir Patrick’s and Professor Whitty’s illustration was not realistic. Professor Mark Woolhouse told the Science Media Centre that, “Many observers may consider this an implausible scenario. Presumably the UK government intends it to illustrate the consequences of sustained exponential growth.”
The Conservative MP Lucy Allan said that the scientists “diminished their credibility with this sensationalist worst case scenario graph. Way out of quilter [sic] with other EU countries. Genuinely hope UK Govt Is not relying on this flawed data.”
The broadcaster Andrew Neil said that the projection of about 50,000 cases a day by mid-October is not based on current trends. And on Sky News, Ed Conway said, “I’m not quite sure why the Chief Scientific Advisor is talking about doubling every seven days…” Mr Conway also expressed doubt over whether regular doubling would continue, citing case numbers from France and Spain. Articles on the BBC, Mail Online and unHerd websites made similar comparisons.
There are several estimates about how fast the epidemic is currently growing in the UK. Daily new cases doubling every week was one of the faster estimates that were publicly available on Monday. It is in line with data from the Covid Symptom app, a partnership between health science company ZOE and King’s College London, which uses symptom reports from the general public to predict who has the virus. And it is only slightly faster than the rate between 22 August and 7 September that was found by the most recent REACT survey (a home-testing study being carried out in England by Imperial College London).
It is not reliable to use confirmed cases from France and Spain as a guide to the progress of the epidemic in those countries, because they are limited by the number of tests being performed.
Even if the outbreak grows at the rate shown on Sir Patrick’s chart, it is unlikely that the UK would report 49,000 cases on 13 October, because of the number of tests that would actually be required to confirm so many cases.
The outbreak may be growing more slowly than their chart suggested, or the rate of growth may slow down, but exponential growth at any rate will produce very high numbers eventually, if it does not change.
Honesty in public debate matters
You can help us take action – and get our regular free email
Sir Patrick and Professor Whitty said that their chart was a rough illustration of what they believed could be expected if new cases doubled every week, with nothing done to stop them.
Sir Patrick said, “At the moment, we think that the epidemic is doubling roughly every seven days. It could be a little bit longer, maybe a little shorter, but let’s say roughly every seven days.” This would represent a daily growth rate of about 10%.
In a statement to Parliament on Tuesday, the Prime Minister claimed that his advisors’ briefing warned that “the doubling rate for new cases could be between seven and 20 days.” However, in their public statement, Sir Patrick spoke only of new cases “doubling roughly every seven days”.
We don’t know how Sir Patrick or his team calculated this figure. The Times reported on Wednesday that a spokesperson for Sir Patrick told them that the seven-day doubling time was “based heavily on the findings of the weekly survey of the Office for National Statistics, and a similar less-frequent survey called React-1, run by Imperial College London.”
However, as Mr Conway noted on Sky News, the government’s own Scientific Advisory Group for Emergencies (Sage), which is chaired by Sir Patrick and Professor Whitty, had estimated a much lower daily growth rate of 2-7% in their latest update. This would be the equivalent of doubling every 10-35 days, although Sage’s growth rate represents “the transmission of COVID-19 over the past few weeks due to the time delay between someone being infected, having symptoms and needing healthcare”. It therefore may not reflect the current situation. (On Friday, Sage updated its daily growth rate to 4-8%.)
Even if the daily growth rate was 7%, at the top of Sage’s range at the time of the briefing, this would substantially reduce the numbers on Sir Patrick’s chart. At that rate, new cases would double about every 10 days, and rise to around 21,600 on 13 October, not 49,000. Or, to put it another way, it would reach about 49,000 new cases on 25 October, 12 days later than Sir Patrick’s chart suggested.
Other ways of estimating the growth rate produce a range of different figures. On 21 September (the day of the press conference) the number of newly reported cases in the UK was growing at about 3-4% a day, but this may be affected by the number of tests available, and the way they are used. The rate may also be different if the cases are counted when the tests were taken, rather than when the results were reported.
The number of cases reported on each day has risen more quickly since Monday.
The number of new hospital admissions with Covid-19 in England was growing faster, at about 7-9% a day, although this typically counts infections that happened some time ago, so it may be out of date. It can also be influenced by changes in medical practice, or in the types of people who are catching the disease, with older people more likely to need treatment in hospital.
The Office for National Statistics publishes a regular infection survey, showing an estimated number of new infections per week. However, the uncertainty in these estimates makes it hard to calculate a growth rate confidently.
The chart below shows what Sir Patrick and Professor Whitty’s chart could have looked like with a wider range of doubling times, still assuming exponential growth, and without any new measures to reduce the spread. It shows that a slower growth rate would delay the moment at which the country reached 50,000 new cases, but not necessarily prevent it.
 What about France and Spain?
Sir Patrick spoke about the epidemics in France and Spain at the beginning of the briefing. Professor Whitty had also compared the outbreak in the UK to the experience in those two countries in a briefing on 9 September.
However, Ms Allan, Mr Conway and others claimed that the projection in Sir Patrick’s slide showed a far greater rise in new cases than other European countries had experienced. “We know from looking at some countries in Europe, that’s not really happening,” Mr Conway said. By his projections, if the UK continued to follow the path of Spain and France, it would report about 10,000 cases a day by mid-October, not 49,000.
This might be true about the number of reported cases, but it is not reliable to judge the growth rate solely by reported cases, because they are limited by the number of tests being performed, and therefore only represent a fraction of the number of infections actually happening.
This is particularly true in France and Spain, where the number of cases has not continued to rise exponentially, in the way that Sir Patrick’s projection for the UK did, but where the proportion of positive tests has also risen steadily.
This means that cases are not just rising, they are also becoming easier to find, which suggests that the reported case numbers represent a smaller and smaller proportion of the total outbreak. In short, the outbreaks in both countries are probably growing faster than the case numbers alone would suggest.
Full Fact fights for good, reliable information in the media, online, and in politics.
Bad information ruins lives. It promotes hate, damages people’s health, and hurts democracy. You deserve better.