Are half of British households a burden on the state?
"Half of Britain is a burden on the state," the Sunday Times reported over the weekend.
A number of newspapers also reported the news that the majority of households in the UK are now receiving more in benefits than they contribute to the state through taxes.
Furthermore it was reported that middle-income households (defined as the middle-earning quintile) have moved from being significant net contributors to the economy to significant net recipients, receiving £4,589 more in benefits than paid taxes.
The figures were published by The Centre for Policy Studies which, in turn, referenced Office for National Statistics (ONS) numbers from a report on the effects of benefits and taxes on household income (2010/11).
Join 74,000 newsletter subscribers who trust us to check the facts
Sign up to get weekly updates on politics, immigration, health and more.
Subscribe to weekly email newsletters from Full Fact for updates on politics, immigration, health and more. Our fact checks are free to read but not to produce, so you will also get occasional emails about fundraising and other ways you can help. You can unsubscribe at any time. For more information about how we use your data see our Privacy Policy.
But how exactly did the Centre for Policy Studies come to this conclusion?
The benefits under the microscope include not only those administered by the DWP or HMRC (such as Jobseeker's Allowance, the state pension or tax credits), but also 'benefits in kind' such as education, the National Health Service and travel subsidies.
So what is driving the trend?
One reason why the benefits claimed by the two lowest quintiles outstips their contributions to such a degree is that non-contributory benefits (such as income support, tax credits and housing benefit) are means-tested, meaning that households claiming these benefits tend to be lower in the income scale.
It's also important to add that the large increase in retired households in recent years has an impact upon the data, as most retired households tend not to pay income tax and claim more in benefits through the state pension.
Using ONS data, we broke down the numbers into retired and non-retired households. The chart below illustrates how much each household gains from state benefits or contributes to the national income.
This shows a slightly different picture, as working-age households in the middle-earning quintile contribute more to the state then they receive. Across all income brackets, if you take out pensioners, the percentage of net recipients is 39.6% - not 53.4%. One could therefore argue that a big driver for the increase in the number of net recipients is the rise in the number of retired households.

Even so, as illustrated in the graph below, the numbers of non-retired households that are net 'recipients' from the state is undoubtedly rising:
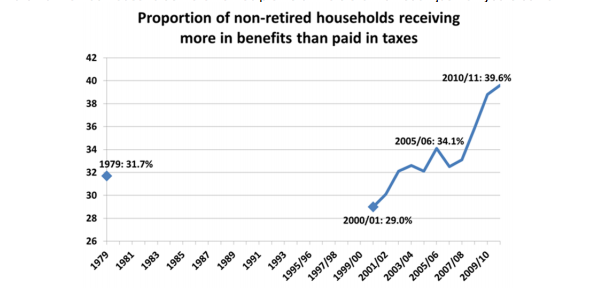
We should point out that where the Sunday Times claims that most households "received more in benefits and public services...than they paid in taxes," we're actually only looking at a selection of services provided by the state - such as health and education - while certain others, such as defence and the police, are outside the remit of the study.
Let's have a look at how the calculation was made using the average household as an example.
The average annual household income is £32,096 - we call this the original income as it is before any government intervention.
Step 1: Through cash benefits (i.e. state pension etc.) the average household gains £5,646. This ups the gross household income to £37,741.
Step 2: £7,453 of that is taken by the state through direct taxes, local taxes and national insurance contributions, after which our household's disposable income is now at £30,288.
Step 3: A further £5,250 goes to the taxman through VAT, duties, and other indirect taxes. Our annual post-tax income is £25,039.
Step 4: At this point we take into account benefits in kind (i.e. health and education). The average household gains £7,089, which takes our final income to £32,127. This means the average household receives £31 from the state annually.
The final step illustrates a minor but important point. A large chunk of what the average household receives from the state is comprised by benefits in kind, so one could conclude that the rise in net recipient non-retired households is in great part due to a rise in education and health spending, rather than welfare spending.
Flickr image courtesy of 401(K) 2012