Budget blues?
In the lead up to tomorrow's Budget, we've looked at a selection of the more striking claims in the PM's speech.
First up, a swipe at the previous Government. According to David Cameron, "youth unemployment went up by 40 per cent under Labour".
Not a good stat for Labour, yet the party appears to be proud of its record in office. Liam Byrne, Shadow Secretary of State for Work and Pensions, claims that:
"Labour's legacy was falling youth unemployment and a pioneering programme to get 200,000 young people back to work. The Tories scrapped that programme and now youth unemployment has escalated to a record high."
So what's happened to youth unemployment rates in the UK over the past 20 years?
Join 74,000 newsletter subscribers who trust us to check the facts
Sign up to get weekly updates on politics, immigration, health and more.
Subscribe to weekly email newsletters from Full Fact for updates on politics, immigration, health and more. Our fact checks are free to read but not to produce, so you will also get occasional emails about fundraising and other ways you can help. You can unsubscribe at any time. For more information about how we use your data see our Privacy Policy.
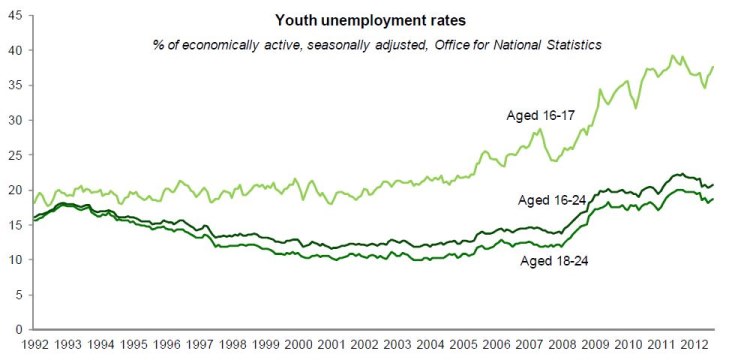
Source: House of Commons Library via the Office for National Statistics
The graph above shows us that the youth unemployment rate dropped during Labour's early years and remained steady thereafter - that is, until the recession of 2007/8. By early 2010 overall youth unemployment had hit 20%.
David Cameron's claim - that under Labour youth unemployment increased by 40 per cent - is borne out by the figures. When Tony Blair entered office in 1997, the youth unemployment rate was around 14%; when Gordon Brown resigned as PM in 2010, it had reached around 20% (an increase of just over 40%).
It's important to note that these figures include people in full-time education. Therefore part of the increase in the unemployment rate may be explained by the fact that more young people are continuing with their studies (although those in full-time education are counted as employed if they also have a part-time job).
Since the Conservatives formed a government with the Lib Dems in May 2010, the youth unemployment rate has generally risen, peaking in 2011 at over 22%. Now we're back down to around 21%.
Is this the "record high" that Mr Byrne claims it is? The Labour Force Survey from the ONS includes unemployment data from the early 1980s - although it's limited in coverage. The figures aren't directly comparable to today's due to methodology changes, but broadly speaking the rates we're seeing now are higher than the 19.6% recorded in 1984 - so this is a "record high" by recent standards.
Next, Mr Cameron's claim that there are "more private sector firms in existence than any other year in our history".
This is true. Statistics from the Department for Business, Innovation and Skills (BIS) show that there were an estimated 4.8 million private sector businesses in the UK at the start of 2012. This is the highest estimate since 2000, which is the earliest point that we can make comparisons between data.
The graph below shows the change over the last decade:
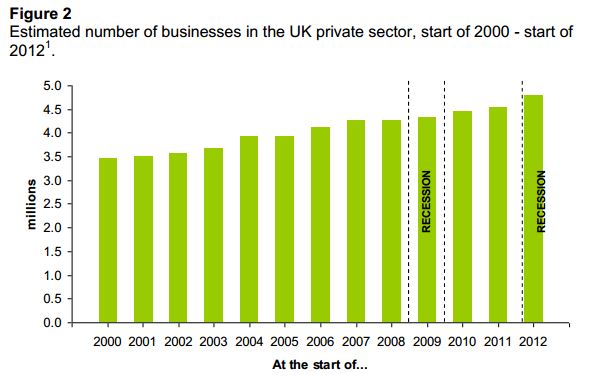
BIS figures also show the picture behind-the-scenes. While the number of businesses has grown consistently, the fastest rate of growth has been amongst businesses with no employees (these are mainly sole proprietorships) while the number of large businesses (with more than 250 employees) has fallen since 2000.
There is earlier data. Between 1994 and 2009, BIS produced Small and Medium Enterprise statistics. These were produced via an alternative method so, as we've pointed out, it's not strictly comparable to the more recent figures. The data indicates that the total number of UK enterprises never surpassed 3.8 million before 2000.
Finally, David Cameron repeated a Coalition favourite: "The deficit — it's been cut by a quarter."
Full Fact has looked at this claim before, although it continues to spark controversy among some commentators. The claim is based on figures from the ONS which confirm that public sector net borrowing (the gap between public expenditure and revenue that the government needs to plug through borrowing) has fallen from £159 billion in 2009/10 to £121 billion in 2011/12 (24%).
These financial years aren't perfect measures of the Coalition's 'effect' on the deficit, so we can only really say the the deficit has fallen by this much under the Coalition rather than entirely because of it. But what's more, public sector net borrowing isn't the only measure available.
Labour claim the deficit is 'rising' based on a slightly different reading of the data. For instance, if you compare net borrowing for the last six months of 2012 compared to the last six months of 2011, it's actually higher by about £6 billion. So while the deficit is being cut overall, the direction it's going in at any one time fluctuates. At the moment, it's rising - so the actual amount cut since 2009/10 is less than 24% anyway.
Some also argue that looking at the current budget is a better measure of borrowing because it excludes investment spending, so it just gives us a measure of current income minus current expenditure. Taking investment out of the equation alters the picture somewhat - the current budget deficit has fallen from -£110.3 billion in 2009/10 to -£92.3 billion in 2011/12 (16%).