Did Labour lift one million households out of fuel poverty?
Caroline Flint: "The Labour Government left office with one million fewer people in fuel poverty than we inherited in 1997."
Ed Davey: "The right honourable Lady ought to know that we saw a massive V-curve because of how fuel poverty was measured under the previous Government—fuel poverty came down earlier in their period of office and shot up dramatically as global gas prices increased. She is not living in the real world if she thinks that is the correct way to measure fuel poverty."
House of Commons, 16 May 2012
Fuel poverty took centre stage in the House of Commons last night as MPs debated what impact the Queen's Speech may have on the cost of living up and down the country.
Join 74,000 newsletter subscribers who trust us to check the facts
Sign up to get weekly updates on politics, immigration, health and more.
Subscribe to weekly email newsletters from Full Fact for updates on politics, immigration, health and more. Our fact checks are free to read but not to produce, so you will also get occasional emails about fundraising and other ways you can help. You can unsubscribe at any time. For more information about how we use your data see our Privacy Policy.
Shadow Energy and Climate Change Secretary Caroline Flint argued that the proposed legislation "fails to help families, squeezed households and pensioners to deal with the cost of living crisis."
According to her the present Government was failing to live up to the standards set by the previous administration, when one million people were lifted out of fuel poverty.
But Energy and Climate Change Secretary Ed Davey hit back, accusing his opposite number of masking the underlying problem with her use of the figures.
So what do they actually tell us?
One million out of fuel poverty?
Statistics on fuel poverty are produced by Mr Davey's own department, but using them to measure the success of the last Labour Government can prove tricky.
Frustratingly, figures were not produced for 1997, the year Labour took office. To evaluate its performance we must therefore use either the preceding or following year as the benchmark.
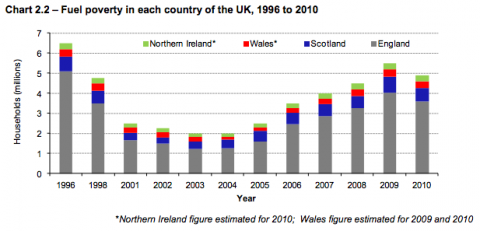
This actually has a significant impact upon the results: in 1996 6.5 million households were classed as 'fuel poor', whereas in 1998 the figure had fallen to 4.75 million.
In 2010 - the year Labour left office - there were also 4.75 million households in fuel poverty. Caroline Flint's claim can therefore be stood up if we use the 1996 figure, but can't if we use the 1998 benchmark. If we assumed that the 1997 level was exactly midway between the '96 and '98 levels, we'd be left with a hypothetical figure of 5.625 million households in fuel poverty for 1997, which is almost a million more than were similarly classed in 2010.
What's driving the trends?
As the graph above shows, there is something of the 'V-curve' identified by Ed Davey. The level of fuel poverty fell between 1996 and 2004, but has risen in every year since (with the exception of 2010).
So how much credit can Caroline Flint claim for any fall over Labour's 13 years in office?
According to the Department for Energy and Climate Change's annual report for 2012, the fall between 1996 and 2004:
"was largely due to a combination of falling [energy] prices and rising incomes, but the installation of energy efficiency measures in dwellings also helped to reduce energy consumption and therefore bills."
While the Government might be able to point to the direct influence of policies on the take-up of energy efficiency measures, it is more difficult to link it to changes in energy prices.
Similarly, the report notes that the primary driver of rising levels of fuel poverty post-2004 has been increases in the cost of energy.
Are there problems with the fuel poverty definition?
However Ed Davey's wider criticism of Caroline Flint's claim rests on the idea that these figures do not represent "the correct way to measure fuel poverty."
So what evidence is there of this?
Currently, a household is considered 'fuel poor' if it needs to spend more than 10 per cent of its income to maintain "an adequate level of warmth" (considered to be 21 degrees celsius in the living room and 18 degrees in all other occupied parts of the residence).
However in 2011, Ed Davey's predecessor as Energy Secretary commissioned an independent report into the way fuel poverty is measured, headed by the London School of Economics' John Hills.
This produced its final report in February this year and it did indeed find that the current measure was 'misleading'. It said of the definition in use:
"the way in which its scale has been measured officially has had significant flaws, giving a misleading impression both of trends and of the effectiveness of policies to tackle it. This is mainly because the official indicator is based on comparing the ratio between households' energy spending needs and their income against a fixed threshold. This makes it unduly sensitive to changes in price levels as well as to technicalities within its calculation. The trends it reports do not reflect well those in the underlying problems, and its definition can encompass households that clearly are not poor."
To remedy the problem Professor Hills proposed a new measure, which gave greater consideration to the household size and composition when considering what it is 'reasonable' for a given household to have to spend on energy in the home.
Conclusion
Caroline Flint is not wrong to claim that one million households moved out of fuel poverty under Labour, and she can point to official statistics that support her assertion. While there are difficulties associated with measuring the level of fuel poverty that Labour inherited in 1997, hers is a reasonable interpretation of the data that is available, although the influence that the Government actually asserted in driving this trend is far more difficult to pin down.
Equally however Ed Davey can legitimately point to some reasons to be cautious about this claim. As he notes, the claim largely rests on the years 1996-2004, when energy prices were falling, and subsequent years have seen some steep increases to the number of households considered 'fuel poor'.
Similarly, the usefulness of the current measure of fuel poverty itself has been called into question by an independent review which found that the trends drawn may be misleading.