How many 'affordable' homes are being provided in London?
Ken Livingstone campaign, 19 April 2012

Boris Johnson campaign, 20 April 2012
Join 72,953 people who trust us to check the facts
Sign up to get weekly updates on politics, immigration, health and more.
Subscribe to weekly email newsletters from Full Fact for updates on politics, immigration, health and more. Our fact checks are free to read but not to produce, so you will also get occasional emails about fundraising and other ways you can help. You can unsubscribe at any time. For more information about how we use your data see our Privacy Policy.
The Sky News Mayor of London debate last week proved to be the spark of another dispute between the Ken and Boris campaigns, this time on housing.
Ken claimed that from April to September last year there were only 56 affordable homes started in London, a claim covered by Full Fact in December last year. However Boris's campaign put this number at over 2,000.
Channel 4's FactCheck blog initially supported Ken's interpretation of the stats, but this was followed by a scathing attack from Boris's campaign accusing them of mis-counting. Channel 4 later amended their piece.
So what's been going on?
Analysis
The source of the confusion, as is often the case, is not down to either candidate getting their figures wrong, but both candidates getting their figures from different sources. The dispute lies in which is the better source to use.
Before starting it is worth explaining what exactly an 'affordable' house is. The DCLG provides a definition, which states that:
"Affordable housing includes social rented and intermediate housing, provided to specified eligible households whose needs are not met by the market."
Social rented housing is that which is owned by local authorities, housing associations or others who conform to national guidelines for rent. Intermediate housing is priced above social rent but below market prices, and must conform to the same national standards.
So affordable housing, as the London Tenants Association point out, does not have to be strictly 'affordable', it just has to lie below market prices.
Affordable housing statistics can be found from two main sources, the Homes and Communities Agency (HCA) and the Department for Communities and Local Government (DCLG).
Ken's source
The HCA supply the latest statistics on affordable homes built under a number of different Government schemes. These include the National Affordable Housing Programme, the Local Authority New Build Programme, FirstBuy, the Kickstart Housing Delivery Programme and the Property and Regeneration Programme.
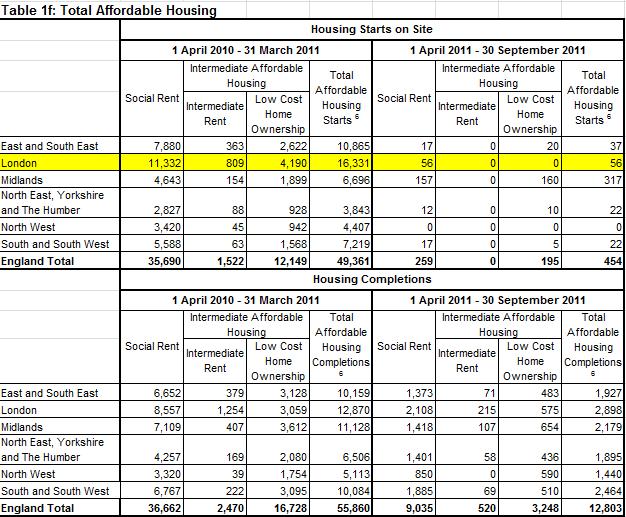
As Full Fact has previously shown, this is where Ken's figure comes from. The table from the HCA below shows the figures for the six month period in question.

It is quite noticeable that there is a steep drop in the number of affordable housing starts compared to the previous financial year, even when you consider that this covers double the length of time.
The reason for the discrepancy is that the April to September period last year was one of transition between two different affordable house programmes. The National Affordable Housing Programme, set up under the previous Government, ended in March 2011. It is being replaced by the Affordable Homes Programme, which began in the second half of 2011.
This means that the six months inbetween the NAHP ending and the AHP starting would have included little more than the "commitments entered into prior to the closure date [of the NAHP]" as the HCA puts it.
So while Ken's figure is not wrong, it does choose a highly unusual period that is likely to produce an anomolously low figure for the number of affordable housing starts.
Boris's source
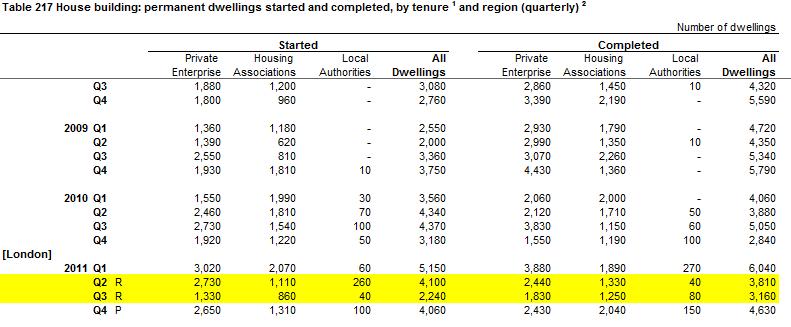
Boris Johnson's figures come from the Department for Communities and Local Government, which he referenced during the London Assembly Mayor's Question Time from 14 December last year. They show the following:

At first glance, Boris Johnson's 2,240 starts figure appears in just quarter three of 2011. However this includes 'private enterprise' starts which many not meet the 'affordable homes definition'.
As Boris Johnson's campaign pointed out to Channel 4 FactCheck however, the correct way to read the table is to take both quarters two and three (the same six month period as Ken) and count only the Housing Association and Local Authority statistics, which sum to 2,270 (likely revised up from the 2,240 originally stated).
After contacting the DCLG, they confirmed to Full Fact that the statistics could indeed be interpreted as providing affordable housing figures - however they are not comprehensive.
Which is the best measure?
The main difference between the HCA and DCLG figures is the way in which they are compiled. Boris Johnson rightly points out that the HCA data only records a housing start after the building contractor for the housing development takes possession of the site and the builder and developer have both signed a contract.
Meanwhile, the DCLG informed Full Fact that its statistics are set up to primarily measure house building in general, not affordable housing specifically. In addition, there is the potential for error when determining the number of affordable homes built in large block developments.
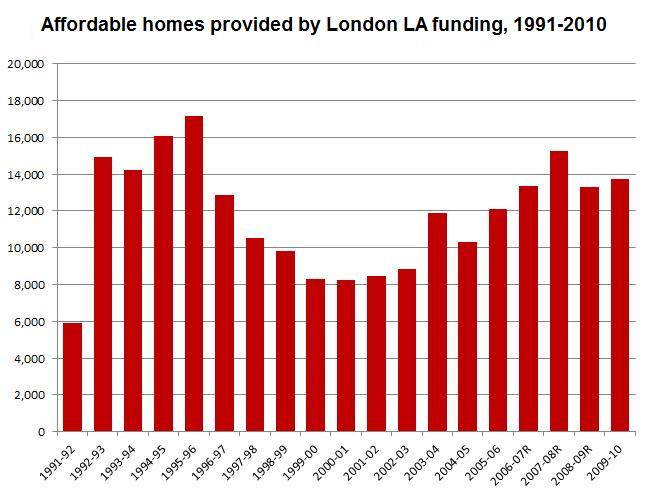
However, they did point out that there are official Affordable Housing Supply Statistics that neither campaign has drawn figures from. Admittedly these only provide data annually up to 2010, and only show those homes built with Local Authority funding, but they do provide some wider background and show the type of housing under the direct influence of government:

An additional point about this measure is that is covers the provision of affordable housing, not just the newly built homes, which captures existing homes that have been acquired by local authorities for these purposes.
Whether this is a 'better' indicator for affordable housebuilding on the Mayor's watch is another matter. But it certainly tells us more to look at provision than simply newly built dwellings as an indicator of what local authorities are actually providing for people year-on-year.
Conclusion
Both Boris and Ken's figures can be found in reputable sources, but the real question is which source tells us more about how many affordable homes are being provided in London.
Ken's source is problematic in that it draws the incredibly small 56 figure from a transition period in between two programmes, and the figure is clearly an outlier - although it is still valid to argue that the transition period should have been handled better to avoid such a dip.
Boris's figures show much more robust levels of housebuilding, and the DCLG agree that his interpretation is valid. However the source itself is still far from ideal.
By using the official affordable housing figures, we can draw a more sane analysis of what the bigger picture looks like. The number of affordable dwellings provided in London year-on-year is broadly stable at around 12-14 thousand - part of an upward trend since the turn of the century.