PMQs roundup: lower inequality, fewer workless households and better social mobility?
This article has been updated.
"The figures simply do not fit with the story he is trying to tell. Inequality is at its lowest level since 1986—fact... Applications from disadvantaged children to universities have gone up, not down—fact. There are fewer workless households."
David Cameron, Prime Minister's Questions, 6 November 2013
With Labour choosing to put pressure on the government over what it sees as a "cost of living crisis", David Cameron today defended "the actions that we are taking to build a fairer country."
After Labour MP David Winnick accused Mr Cameron and Chancellor George Osborne of pursuing "policies that hit the most hard-pressed and most vulnerable," the Prime Minister retorted that the facts didn't back this analysis up.
Inequality is at it's lowest level since the 80s
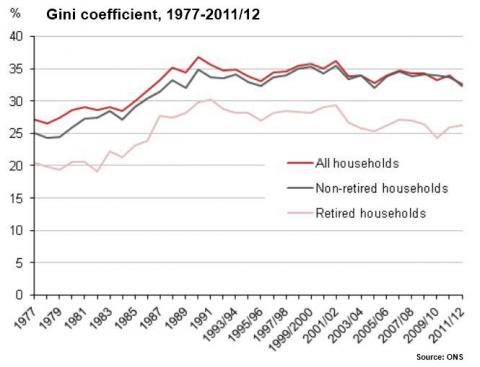
Mr Cameron's claim that inequality is the lowest since 1986 can be traced directly to an Office for National Statistics release from July this year, which reported that "the Gini coefficient for disposable income in 2011/12 was 32.3%, a fall from its 2010/11 value of 33.7%, and the lowest level since 1986."
The Gini coefficient is one of the most commonly used measures of inequality, showing how far the income distribution of a country diverges from perfect equality. A coefficient of 0 (or 0% in the graph below) represents a scenario where all incomes are equal, while 1 (or 100%) represents complete inequality (where, for example, one person holds all the wealth).
The ONS notes that "in recent years the trend has been broadly flat, though the most recent figures have shown a fall in inequality," attributing the fall to an improvement in employment and earnings in the bottom fifth of households, combined with changes in the tax and benefit system, suggesting that government reforms have played a role in the decrease.
While the figures do support the Prime Minister's claim, it is worth remembering that they only cover the period to the end of the 2011/12 financial year, before the most recent round of welfare reforms were introduced this April. The IFS has previously warned that the impact these will have make it uncertain if the downward trend in inequality will be maintained.
More disadvantaged children going to university
UCAS - the body tasked with managing university applications - has two ways of measuring the number of children from 'disadvantaged' backgrounds applying to university: those coming from areas with historically low participation rates in the education system, and those who had previously been in receipt of free school meals.
The numbers applying to university from both groups has risen sharply in recent years. According to UCAS:
"The application rate of young people living in the most disadvantaged areas has increased by over 70 per cent (proportionally) between 2004 and 2013. This compares to an increase of 10 per cent proportionally in the most advantaged areas."
Similarly, while the application rate among those 18-year-olds applying for university who formerly received free school meals still lagged behind those who had not received them (15% compared to 33% respectively in 2013), there have been marked increases in the proportion of this group hoping to pursue higher education.
So while Mr Cameron is correct that the proportion of disadvantaged children applying to university has increased under the Coalition, it seems to be more a continuation of a longer-term trend than something that can be traced to this government's policies in isolation.
Fewer workless households
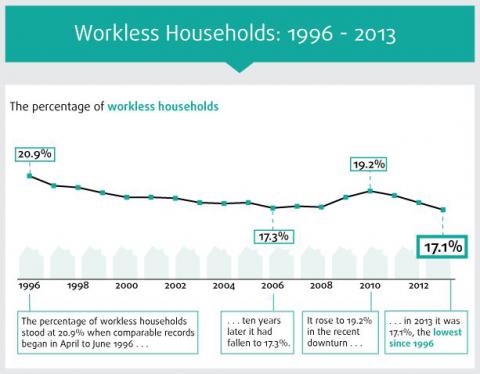
The ONS publishes data on the proportion of households where no member works every year, and pointed out when the latest data was released in August that 2013 marked a new low point since records began.
In this case, records began in 1996, and there has been a downward trend ever since, interupted only by the financial crisis and recession between 2008 and 2010. The 17.1% of households considered workless in 2013 eclipses the low water mark set in 2006, when 17.3% of working-age households contained no person in employment.
Update 12/06/2014: One of our readers has pointed out that the ONS' Gini coefficient is not the only measure of inequality. Other measures have shown rising inequality. Our post discusses how they're different.