Visualising population growth
When the Office of National Statistics (ONS) updated its 2011 census data to include population figures for each local authority, a number of papers took the opportunity to spruce up numbers first published in July.
Both the Daily Telegraph and the Daily Mail on Wednesday, and the Daily Star today, featured stories on population growth in England and Wales. We are told that population has risen by 1,000 every day, and that this is the fastest rise in 100 years.
According to the ONS:
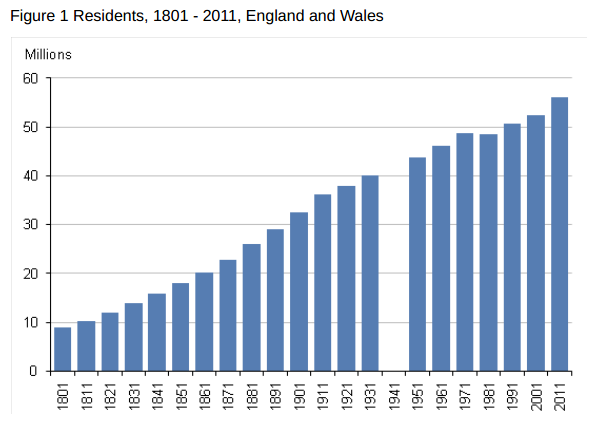
The population of England and Wales has grown by 3.7 million in the 10 years since the last census, rising from 52.4 million in 2001, an increase of 7.1 per cent. This was the largest growth in the population in England and Wales in any 10-year period since census taking began, in 1801. It compares with a rise in population of 1.6 million between 1991 and 2001.
This does indeed signify a rate of increase of 1,000 per day.
The population of the United Kingdom has been steadily rising since 1982, when we had a negative growth rate of -0,4%.
The Daily Telegraph puts the figures in a European context:
"Over the past decade the number living in the country has grown by twice the European average, fuelled by record levels of immigration and a higher birth rate."
The Daily Telegraph is indeed correct, the European average (0.212) is roughly half the UK's growth rate (0.56). It is worthy of note that the UK does not currently have the highest population growth rate in Europe. The rate is also half that of the global average.
In the bar chart below, we can see how 18 out of 50 countries in Europe have a declining population, which brings the European average down considerably.
Flickr image courtesy of Jaako.