What’s happening to knife crime?
This week’s headlines have been dominated by discussion of knife crime. There’s no single measure that can perfectly capture trends in knife crime, or violent crime more generally, but there are a lot of figures out there that can shed light. Unless otherwise stated, all data in this piece refers to England and Wales.
Join 72,953 people who trust us to check the facts
Sign up to get weekly updates on politics, immigration, health and more.
Subscribe to weekly email newsletters from Full Fact for updates on politics, immigration, health and more. Our fact checks are free to read but not to produce, so you will also get occasional emails about fundraising and other ways you can help. You can unsubscribe at any time. For more information about how we use your data see our Privacy Policy.
The evidence suggests knife crime has been rising in recent years
Knife crime in England and Wales is almost certainly rising at the moment, but limitations with the available data make it hard to draw specific conclusions. We don’t know enough to say how quickly overall knife crime is rising or if it’s currently worse than it’s ever been.
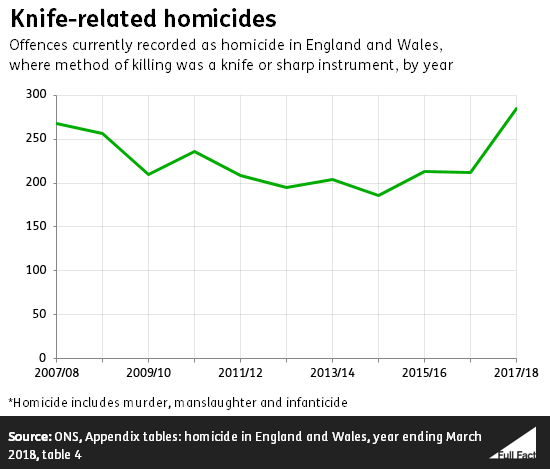
The clearest picture we have is for knife-related homicides, which are at their highest level since recording began in 1946. 285 people were killed by knives and sharp instruments in 2017/18. The previous record high was 268 in 2007/08.

The trend is less clear for overall knife crime.
Police-recorded knife crime has been rising consistently since 2014, with about 40,000 incidents in the 12 months to September 2018. That will probably reflect some genuine increase, but there’s a snag.
The trouble with the data—which comes from police records—is that the police have been improving how they record crime in recent years, so they might be noticing more knife crime than they used to. We also only have data back to 2011, so we can’t get a good sense of longer historical trends.
Another source we can look at is hospital admissions for incidents related to sharp objects (this is for England only). These types of admissions have been rising and are at near-record levels (since records began in 1998), with around 5,000 cases in 2017.
The majority of recorded knife crimes in England and Wales are robberies and assaults
There were 18,000 assaults and 17,000 robberies involving a knife or sharp object in the year to September 2018, as well as 3,000 threats to kill.
Very few of the 40,000 or so police-recorded knife crimes involve murder. That said, knives are the most common method of homicide in England and Wales, accounting for 40% of cases in 2017/18. This level has remained fairly constant over the last ten years.
Police numbers have been falling
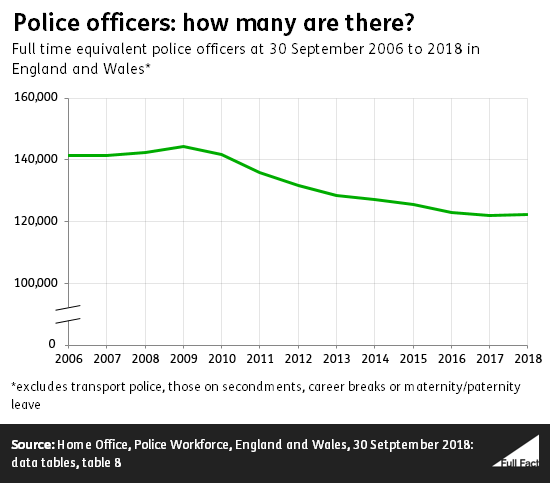
We can say more confidently that the number of police officers in England and Wales has been falling in recent years: from around 144,000 in September 2009, to just over 122,000 in September 2018—a fall of 15%.

Numbers had been falling year-on-year from 2009 onwards, until a slight increase of around 500 officers in the year to September 2018.
Earlier this week, Theresa May responded to a question about whether the fall in police numbers had contributed to the rise in knife crime by saying: “if you look at the figures what you see is that there’s no direct correlation between certain crimes and police numbers.”
This statement has received significant criticism, with the Commissioner of the Metropolitan Police saying: “there is some link between violent crime on the streets obviously and police numbers, of course there is, and everybody would see that.”
Police numbers and violent crime rates obviously have some link, but we don’t have good enough evidence to say how strong this is. Downing Street has since accepted that police resources are relevant to combating violent crime.
21% of those with knife-related convictions were under 18
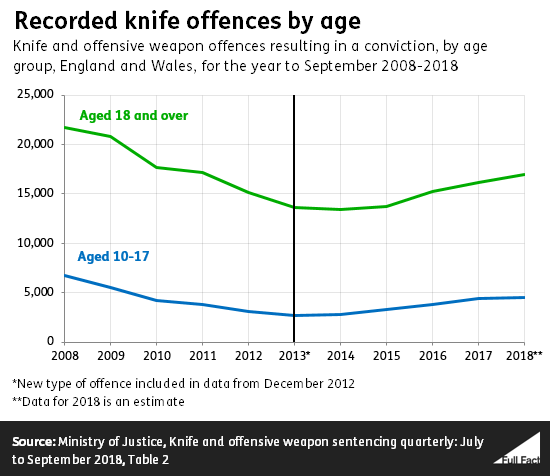
Of those convicted or cautioned for offences involving knives and offensive weapons in England and Wales in the year to September 2018, an estimated 21% were aged 10 to 17. They make up 10% of the overall population in England and Wales aged 10 and over.
But bear in mind that this only covers cases where someone was caught and convicted.

London has above average levels of knife crime
Knife crimes are “disproportionally concentrated in London” according to the Office for National Statistics (ONS). 35% of all crime involving a knife or sharp instrument across England and Wales happened in London, in the 12 months to September 2018.
The ONS adds: “The Metropolitan Police saw 168 offences per 100,000 people in the latest year… The highest rates after London were seen in West Yorkshire, Greater Manchester and the West Midlands (118, 112 and 107 offences per 100,000 population respectively)”.