Stop and search: the racial imbalance
- Stops and searches can take place under a variety of different laws
- Overall, black people are six times as likely to be stopped and searched as white people
- Higher ratios apply to certain local areas and specific legislation, but these can be unreliable
Stop and search powers exist across a range of legislation
There are three main Acts under which stop and search powers are exercised and recorded by the ethnicity of the people concerned:
- Section 1 of the Police and Criminal Evidence Act 1984 [PACE]
- Section 60 of the Criminal Justice and Public Order Act 1994 [CJPO]
- Section 47A of the Terrorism Act 2000 (previously Section 44)
This isn't a complete list: other legislation also gives police stop and/or search powers, although there's less information about how often and where they're carried out. This includes the the Firearms Act 1968, the Misuse of Drugs Act 1971 and via the Road Traffic Act 1988.
The overwhelming majority of stops and searches take place under section 1 of PACE 1984: 1.1 million were recorded in 2011/12. For these, a police officer must have 'reasonable grounds' for suspicion that someone has a stolen or prohibited item. Guidelines that exist for police officers set out broad rules for what counts as 'reasonable' grounds.
Join 74,000 newsletter subscribers who trust us to check the facts
Sign up to get weekly updates on politics, immigration, health and more.
Subscribe to weekly email newsletters from Full Fact for updates on politics, immigration, health and more. Our fact checks are free to read but not to produce, so you will also get occasional emails about fundraising and other ways you can help. You can unsubscribe at any time. For more information about how we use your data see our Privacy Policy.
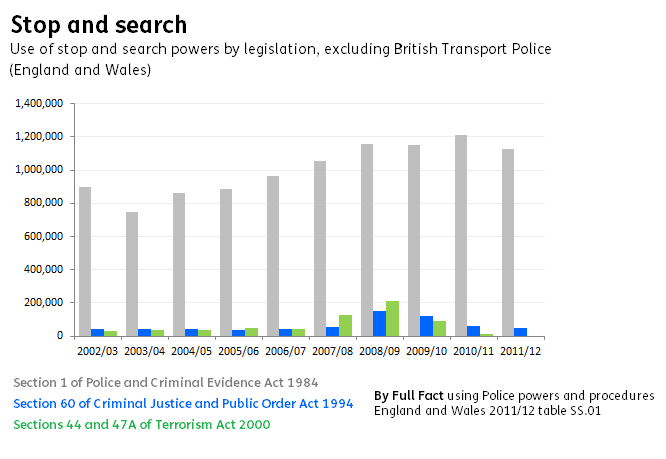
Last year 46,000 stops and searches were carried out under Section 60 of CJPO 1994: these happen on the approval of a senior police officer if it's suspected that serious violence could take place or that people are carrying weapons in a specific local area. They're intended to prevent violence at large-scale events such as football matches.
Section 44 of the Terrorism Act 2000 was scrapped in 2010, as a result of a legal challenge through the European Court of Human Rights. The Court concluded that the powers were not defined well enough and were susceptible to abuse. This has since been replaced with what the Home Office describes as a "more targeted and proportional power". There aren't any figures yet for people searched under this law.
Black people are six times as likely to be stopped and searched as white people in England and Wales
- For every 1,000 white people, 17 were stopped and searched in 2011/12
- For every 1,000 black people, 104 were stopped and searched in 2011/12
- For every 1,000 mixed-race people, 39 were stopped and searched in 2011/12
The difference varies by local police force: in Dorset the ratio of black to white searches is 12:1. In Northumbria it's about even at 1:1.
People being searched report their ethnicity; this information is then used by the Ministry of Justice to compare how many people of different ethnicities are searched compared to estimates of the population by ethnic group.
Higher ratios aren't necessarily as reliable
Another ratio often mentioned is that black people are 29 times as likely to be stopped and searched as white people. This refers only to those 46,000 stop and searches which happen under section 60 of CJPO 1994.
The Equality and Human Rights Commission (EHRC) found last year that, for stops and searches under this act, black people were 29 times as likely to be affected. This also happens to be the same ratio as for the West Midlands - the most disproportionate local example.
But the Ministry of Justice (MoJ) advises against making this comparison for section 60 stops alone. It says:
"Because this specific stop and search power is only used at specific times, it is not appropriate to calculate rates per 1,000 population."
The problem being highlighted is that since section 60 stops tend to take place at large events with a chance of violence (such as football matches) the kinds of people who attend these events aren't necessarily representative of the local population.
It's also possible that people travel to large events from a wide catchment area and this also makes comparing the searches with the local population mix difficult.
Local areas can also yield misleading figures. In 2012 when the EHRC reported on the use of section 60 stops and searches, they confirmed to Full Fact that, while black people were 37 times as likely to be stopped and searched across England and Wales at the time, the most extreme example was in Gloucestershire where they were 177 times as likely.
They emphasised that this was due to the small number of stops that took place in these areas, combined with the fact that areas like these had predominantly white populations.
More information
- Ministry of Justice statistics on Race and the Criminal Justice System and the Home Office's user guide to understanding the numbers
- Equality and Human Rights Commission race disproportionality in stops and searches report - detailed analysis of statistics by Act
- HM Inspectorate of Constabulary 2013 investigation into use of stop and search powers - analysis of how effective stops and searches are
- House of Commons Library briefing note on stop and search - background and commentary on recent developments