Crime in England and Wales
Join 74,000 newsletter subscribers who trust us to check the facts
Sign up to get weekly updates on politics, immigration, health and more.
Subscribe to weekly email newsletters from Full Fact for updates on politics, immigration, health and more. Our fact checks are free to read but not to produce, so you will also get occasional emails about fundraising and other ways you can help. You can unsubscribe at any time. For more information about how we use your data see our Privacy Policy.
What the figures tell us - and don't tell us
- Crime as experienced and recounted by adults is falling in general and has been since the mid-1990s.
- But recently certain kinds of crime, particularly violent crime, have been increasing.
- An estimated one in five adults were victims of crime in the year to September 2017, counting offences covered by the Crime Survey. 20 years ago, it was about two in five.
- Crime is also measured by the police, who recorded 5.3 million offences over the same period. That’s 14% more than in the previous year. This doesn't necessarily all represent rising crime, as recording methods have improved. However there has been a genuine rise in some types of crime.
- Sexual offences recorded by the police rose by 23% last year, the biggest number reported since new counting rules introduced in the early noughties. Again, this is thought to be affected by improvements in recording and a greater willingness of victims to come forward and report the crimes.
How is crime measured?
Crime is very difficult to measure accurately. People who commit crimes don’t stand up to be counted, and often people who are victims don’t talk about it either.
It’s also a hugely broad term – it covers everything from murder and rape to possessing cannabis or downloading something illegally.
That’s why single, headline numbers about crime never give you the full story.
In England and Wales, crime figures also come from two different sources. They each provide different figures and have their own strengths and weaknesses.
The Crime Survey for England and Wales has been in place (it used to be called the British Crime Survey) since the 1980s. It asks very large representative samples of the population about the crimes they have experienced; victims are also asked whether they reported their incidents to the police.
Because of this, the Survey habitually picks up many more crimes than are actually reported to the police. It also gives us a consistent picture of trends in crime over the last few decades.
But the Survey has its limits too. It’s not as good at picking up crimes that don’t happen very often like gun crime, particularly in the short-term. It can’t tell us at all about crimes where there isn’t an individual victim in the normal sense, like drug possession or crimes against businesses. It also can’t tell us about murder, because there’s no victim to recall the event.
The other main source, and the most long-standing set of statistics on crime are those recorded by the police. For a crime to be recorded, someone (or something) must bring the incident to the attention of the police and the police must decide to record the incident as a crime.
The police figures give us a sense of what the police are dealing with and can be good for measuring rarer crimes that the Survey struggles to pick up. They’re also extensive enough to be used in local areas, which you might have come across if you’ve ever seen a crime map of your neighbourhood.
But the police figures also have many flaws. They can’t pick up crime that isn’t reported to the police, which is a particularly problem in cases of domestic violence and sexual offences. They’re also only as good as the police’s own recording practices, which haven’t been consistent in quality over time.
Even if they are recorded consistently, if a local police force chooses to focus on tackling a certain kind of crime, this might increase the number of crimes recorded even if the true level isn’t rising at all.
That means the police figures can’t be used as a reliable indicator of trends in crime over time.
Recent trends in crime
Crime as measured by the Crime Survey is falling, but crimes recorded by the police are rising. So what’s going on?
As we’ve mentioned, the two sources of information don’t quite measure the same things, so we would never expect them to match. But that doesn’t explain the diverging trends we’ve been seeing.
It’s clear that one explanation is that way in which crime is recorded by the police has been changing.
One thing the ONS does is to take a comparable group of crimes that are picked up both by the police and the Crime Survey, and calculates the gap between them. If all of the crimes people in the survey say they reported to the police were eventually recorded by the police, there shouldn’t be much of a gap.
But until recently, that hasn’t been the case.
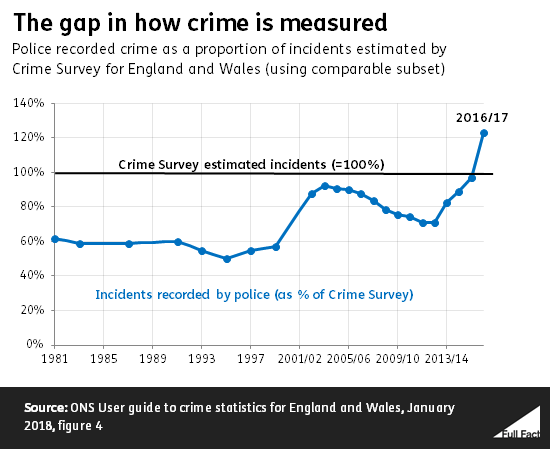
This measure clearly shows the results of changes to recording in 2002. National Crime Reporting Standards were introduced and are estimated to have increased recorded crime by 10% in the first year.
But following that sudden rise until 2012/13 the proportion of crimes recorded by the police fell and the 'gap' between crimes picked up by the Survey and those recorded by the police grew.
This was seen as partly because the auditing of crime recording was suspended in 2007, and partly because the police were criticised for 'red-tape' approaches to record keeping.
So police figures are likely to have overstated the rate of falling crime at that time.
The gap has been closing since 2013/14, possibly in response to criticisms of poor police recording practices. So police recording shows an increase in crime, even though the crime survey suggests it’s falling.
In 2016/17, the police actually recorded more comparable crimes than the crime survey picked up for the first time (that’s the line in the graph passing 100%). This doesn’t mean the police are somehow ‘over recording’ crime.
The ONS’s explanation is that the crime survey misses out some victims, particularly people living in care homes (both children and older people). Since 2015 police have also recorded reports from third-parties, such as social services and medics, as crimes even if the victim didn’t report it. So the police are recording crimes against more victims than the survey reaches.
The ONS estimated around 41% of comparable crime from the crime survey was reported to the police in the year to March 2017.
Long-term trends in crime
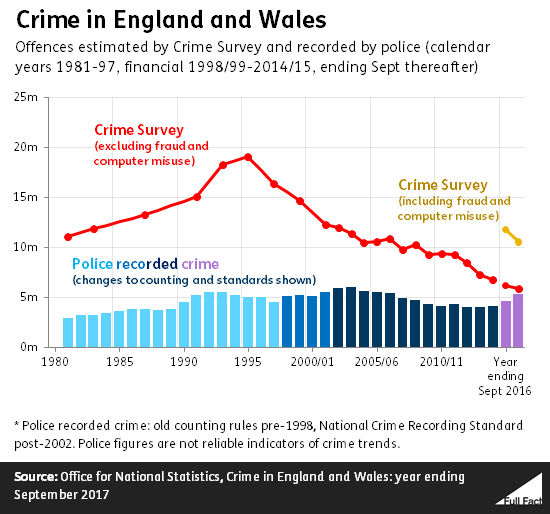
Crime has been falling since the mid-1990s according to the Crime Survey — as in many other developed countries. Police-recorded crimes also fell at that time, but then increased later in the 1990s, starting to fall again in the mid-2000s. In the last few years it has been rising again.
The 'dark figure' of unrecorded crime in England and Wales—indicated by the gap between the two measures—shrank from the mid-1990s as crime as reported in the survey fell.
From the 1980s to the mid-1990s the proportion of crime that victims in the Crime Survey said they’d reported to the police increased. Until the 1990s the recording rate (the proportion of reported crimes that ended up in police statistics) rose at roughly the same rate.
The result of these two trends was that the police statistics overstated the 1980s rate of increase in crime. More people were reporting crime to the police and the same proportion of those reports were actually recorded, but the total crime people experienced was increasing at a slower rate.
Since 1990 the reporting rate (the difference between the number of crimes reported, as measured by the Crime Survey, and the number of crimes recorded in the Crime Survey) has remained stable, but the proportion of reported crime that the police record has fluctuated a great deal.
Thanks to Professor Mike Hough, formerly at the Institute for Criminal Policy Research, for help in writing an earlier version of this article