The 1% and you: Closer than you think?
"Richest 1% will own more than all the rest by 2016"—Oxfam, 19th January 2015
Oxfam released a report on Monday predicting that in 2016 over half the world's wealth will be held by just 1% of the adult population.
While the data comes from the Credit Suisse Global Wealth Databook, the forecasts don't. Oxfam have projected the short-term trend from 2010 to 2014 to get this result. In fact, the share of global wealth held by the top 1% is no higher now than it was 14 years ago.
The trouble with trends
Economic forecasting is notoriously difficult, even when the full range of contributing factors are accounted for. So simply assuming that a short-term trend will continue without looking at what's driving the trend doesn't tell you what will happen next—as people who bought houses in 2007 can attest.
Oxfam has also been selective in the timeframe they've used to identify the trend. The graph in their report looks like this:
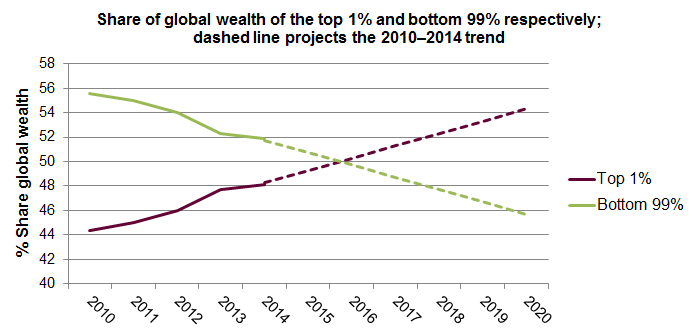
It doesn't show us what's going on before 2010, and it's focused in on the area between 40% and 58%. If we look at a longer period, and use a full axis then we get something like this:
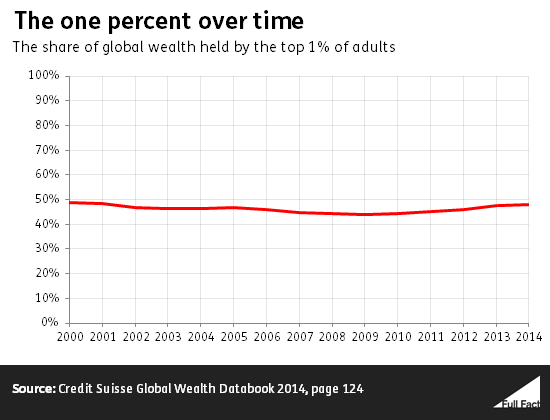
The top 1%'s share of wealth is no higher than it was in 2000.
What it takes to be at the top
Midway through 2014, it took just £2,200 in net wealth to be in the top half of the adult population worldwide.
3.3 billion people—70% of the world's adult population—had less than £6,000 in net wealth, and together accounted for around 3% of all global wealth.
The richest 10% of adults held about 87% of the world's wealth. To be in that group, you needed net wealth of about £46,000.
To be in the richest 1% of adults, you needed £473,000. If you're debt free and own an average priced London house outright, you are the 1%. This exclusive club has almost 50 million members, which is roughly the population of England.
Net wealth is not a measure of living standards
Net wealth in this report is the sum of a person's financial and non-financial assets (primarily housing and land), minus outstanding debt.
This isn't wealth as the sum of material possessions. A nice way to think about it is that it's the amount of money you would have left over if you sold all your assets, and paid off as much debt as you could.
This figure isn't fixed: people tend to borrow and save at different times in their life. A common pattern might be taking out loans to cover the cost of higher education, then paying these debts off and accumulating savings during their working life before running down their savings during retirement.
A young professional may well be counted in the world's poorest 10% because the debt they took on to study gives them a negative net worth. But they were able to borrow this money because they are expected to earn a high income, so this will be a temporary situation. Someone born in a developing country will have a much lower chance of progressing up the scale.
The Credit Suisse report isn't concerned with where people will be in the scale over their lives. It's a snapshot of assets at this point in time, and of the distribution of net worth.
Nevertheless, there's a world of difference in living standards between someone with a low net worth and a high value of assets and liabilities (eg, a house and a mortgage), and someone with a low net worth with few assets and no liabilities.