A number of errors appeared in a graph shown on the BBC News at Six [11:10] on 17 November illustrating the impact of measures announced in chancellor Jeremy Hunt’s Autumn Statement. This was also noticed by at least one person on Twitter.
The graph presented figures showing the combined “cost” of the decisions over the coming years. The original figures in question were published by the Treasury, and show that over the next two years the government will provide a total of around £69 billion in economic support (including already-announced energy and cost of living support measures) before measures to substantially reduce public spending and increase tax revenue take effect.
The same segment was shown again on the evening’s edition of Outside Source [7:00], before being partially corrected for the BBC News at Ten [10:20].
What’s wrong with the original graph?
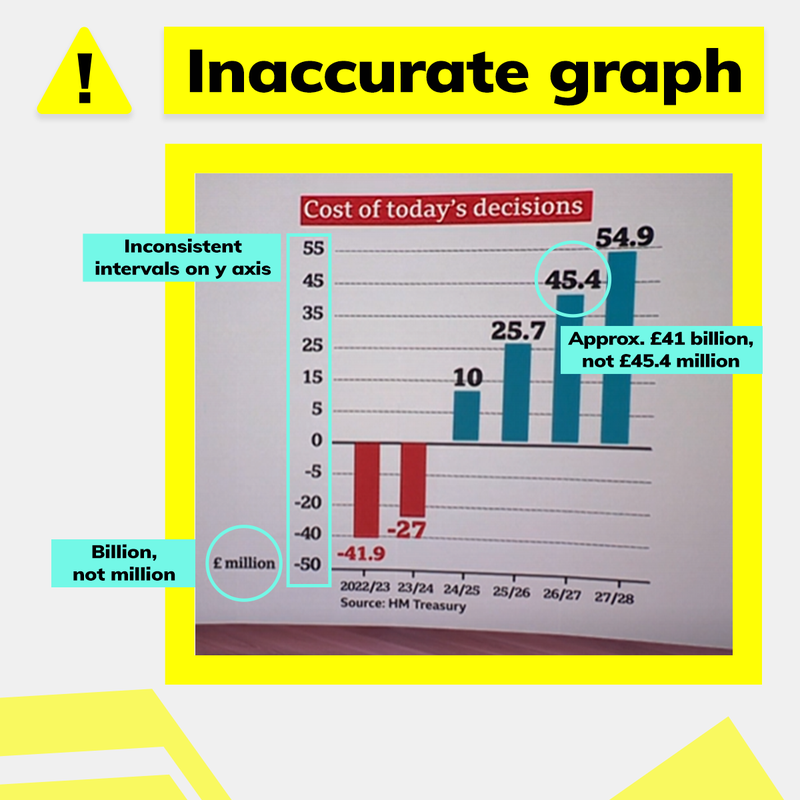
For starters, a label incorrectly states that the figures shown on the graph refer to “£ million”. These figures actually refer to billions of pounds worth of measures.
The graph also misreports the projected impact of the measures outlined in the budget during the 2026/27 financial year as £45.4 million. According to government figures, the correct projected figure for that financial year is approximately £41 billion.
Finally, the graph has been made with inconsistent intervals along the Y-axis. On the positive side of the Y-axis, the first label appears at an interval of 5, with subsequent labels appearing at intervals of 10 despite being the same distance apart.
On the negative side of the Y-axis, the first interval appears at -5. However the next interval appears at -20, the third at -40, and the fourth at -50 (intervals of 15, 20 and 10 respectively).
Taken together, these errors may present a misleading picture of the impact of the Autumn Statement measures each year.
A BBC spokesperson told Full Fact: “A 6 O’Clock News report on the Autumn Statement included a graph with three errors, including tax spend in financial year 26/27 and the value of the Y axis. These were rectified as soon as we realised the mistake and an updated version was used on the 10 O’Clock News.
“We failed to spot an error relating to interval spacing. We understand the importance, for accuracy, of spacing being identical on charts.”
The changed graph shown on the News at Ten featured a corrected figure for the 2026/27 financial year, and also correctly stated that the graph showed figures in “£ billion”. But the inconsistent Y-axis intervals and extra support figures remained unchanged.
The title of the graph was also changed from “Cost of today’s decisions” to “Tax/spend impact, by year”.
In addition to the above errors, there may have been an additional issue with the specific figures used. While the graph’s figures from the 2024/25 financial year onwards refer to the impact of new policies announced in the Autumn Statement excluding cost of living and energy support, the figures showing the impact over the current and next financial year refer to the impact of the new policies including cost of living and energy support.
As the official government figures show, if the chart was intended to be consistent in showing the impact of the measures including the extra support, the figures in the later years should have been slightly lower. In addition, one figure on the chart appears to have been rounded to a whole number, while others have been kept to one decimal place.
We’ve asked the BBC if there was a reason for this, and will update this piece if it responds.
Image courtesy of BBC