This is correct in England, based on government data. The two figures are quite close though—346,000 homes were built in the seven years since 2010, compared to 333,000 in the last seven years of Labour government.
It’s also correct to say that these homes were “delivered” rather than “built”. 92% of affordable homes were newly built in 2016/17, with 7% coming from affordable homes providers acquiring existing private homes.
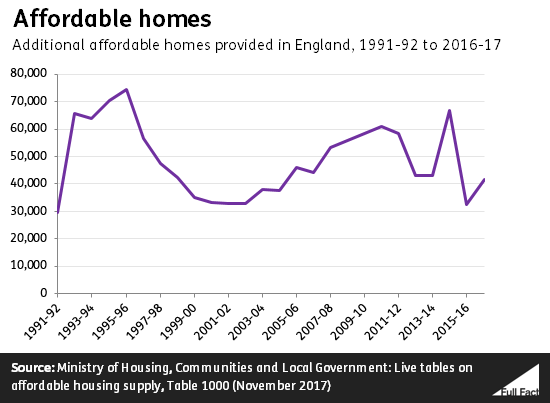
Looking at the trends another way, yearly affordable housing supply has been generally lower in recent years than it was in the late 2000s. The number of affordable homes being added rose year-on-year from 2006/07 to 2010/11. From 2012/13, the number fell sharply, to the lowest level since 2004/05. It has remained at a similar level in all but one year since (2014/15), when an exceptionally high number of affordable homes were added.
Houses built early on under one government could have been started under the previous one, so some homes built in 2010/11 may have been started by Labour.
What is an “affordable home”?
“There is no all-encompassing statutory definition of affordable housing in England” according to the House of Commons Library.
The “most commonly referred to” definition was outlined by the government in 2012, and is what underpins the official data we looked at above. It defines affordable housing as:
“Social rented, affordable rented and intermediate housing, provided to eligible households whose needs are not met by the market. Eligibility is determined with regard to local incomes and local house prices.”
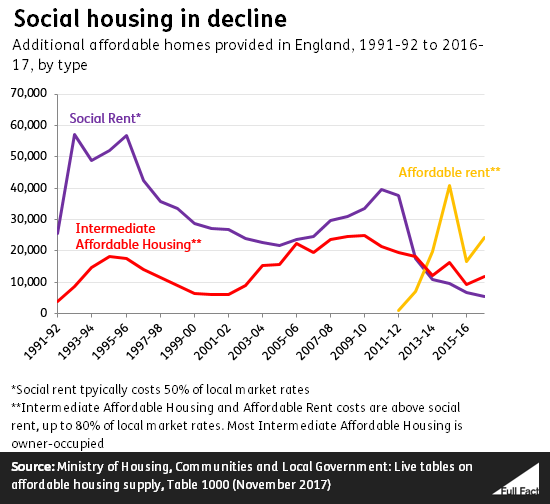
“Social rented housing” is “owned by local authorities and private registered providers”. It typically costs 50% of the local market rate.
“Affordable rented housing” was first delivered in 2010/11. It allows housing associations to offer rents at up to 80% of market levels within the local area.
“Intermediate housing” refers to homes for sale and rent, provided at a cost above social rent, but below 80% of local market levels. Some are sold through shared ownership and equity loans. 92% of intermediate housing added since 2003/04 has been for home ownership, rather than rent.
The amount of social rented housing has declined significantly since 2011/12—from around 40,000 homes added then, to roughly 5,000 in 2016/17.
Looking at the same two years, the number of affordable rented homes has risen from around 1,000 to around 25,000.
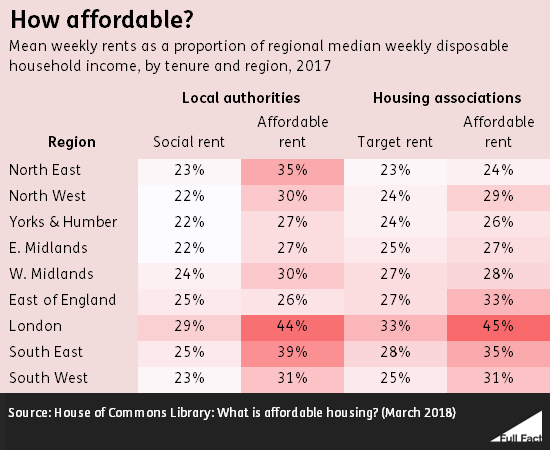
On average, affordable rents are higher than social rents and “target” rents (the Housing Association equivalent of social rents).