What was claimed
Household savings are the lowest in 50 years.
Our verdict
This is correct, looking at total household savings as a percentage of total household incomes, although these figures don’t give the fullest picture.
What was claimed
Household savings are the lowest in 50 years.
Our verdict
This is correct, looking at total household savings as a percentage of total household incomes, although these figures don’t give the fullest picture.
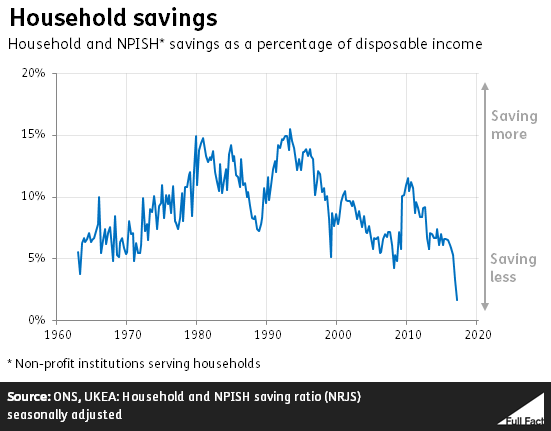
“Household savings are lower than at any time in the last 50 years”
Jeremy Corbyn, 13 September 2017
As a percentage of households’ take-home pay, this is correct.
This was widely reported in the summer, when the latest figures were released by the Office for National Statistics. The average saving ratio in January to March 2017 was estimated at 1.7%—the lowest ratio since records began in 1963.
Savings here refers to how much of your income you put aside in savings, plus whatever you don’t happen to spend from the rest of your income. So it’s about how much money you end up with at the end of the month once you’ve paid your bills, gone to the cinema etc. as a proportion of how much money you had coming in to start with.
A fall in this number means that, on average, households aren’t saving as much as they used to, and are spending more of the money they get.
Join 74,000 newsletter subscribers who trust us to check the facts
Sign up to get weekly updates on politics, immigration, health and more.
Subscribe to weekly email newsletters from Full Fact for updates on politics, immigration, health and more. Our fact checks are free to read but not to produce, so you will also get occasional emails about fundraising and other ways you can help. You can unsubscribe at any time. For more information about how we use your data see our Privacy Policy.
The ONS points to increased consumption, increasing prices and lower wage growth to answer this. It adds that while the saving ratio is often volatile, “the underlying trend is downwards”.
For any given household, low savings doesn’t necessarily mean the household is in in a bad way economically. For example, a household might not be too concerned about saving if it had some certainty about its future income.
There are limits to what these figures can tell us.
For one, the saving ratio is an average—many households will be saving more than 1.7% of their income and many will be saving less or even spending more than they earn, racking up debt.
The figures also include savings from non-profit institutions serving households (NPISH), such as charities and universities, which you wouldn’t necessarily assume given what it’s called. The figures are likely to differ if you take these out of the picture.
In future, the ONS intends to report household and NPISH data separately, and introduce a number of other methodological changes.
Full Fact fights for good, reliable information in the media, online, and in politics.
Fact checking claims made by politicians, public figures and viral online content can give you the full picture backed by the evidence.
Subscribe to weekly email newsletters from Full Fact for updates on politics, immigration, health and more. Our fact checks are free to read but not to produce, so you will also get occasional emails about fundraising and other ways you can help. You can unsubscribe at any time. For more information about how we use your data see our Privacy Policy.