Are Britain's richest families worth more than the poorest 20%?
This article has been updated.
"Britain's five richest families worth more than poorest 20%." The Guardian, 17 March 2014.
In anticipation of Wednesday's budget announcement, Oxfam released figures relating to what they described as the extreme levels of wealth inequality in the UK.
The Guardian was among a number of newspapers to pick up on the claims, as were The Telegraph, the Independent and ITV News.
The two global datasets that the claims are based on show the wealth of the five richest families in the UK to be the same as the bottom 20%, although there are question marks about how comparable they are.
Join 73,000 newsletter subscribers who trust us to check the facts
Sign up to get weekly updates on politics, immigration, health and more.
Subscribe to weekly email newsletters from Full Fact for updates on politics, immigration, health and more. Our fact checks are free to read but not to produce, so you will also get occasional emails about fundraising and other ways you can help. You can unsubscribe at any time. For more information about how we use your data see our Privacy Policy.
Poorest 20% have 0.4% share of wealth
Figures on wealth distribution can be obtained through the ONS's Wealth and Assets survey, the latest data for which is available to 2010.
Oxfam bases its figures on more recent calculations by Credit Suisse in their 2013 Global Wealth report - which updates the Wealth and Assets Survey data with its own projections.
Credit Suisse's report finds that the bottom 10% of the UK's population owned 0.1% of the total wealth in the UK.
Looking at the bottom 20%, this group shared 0.4%, or £28.18 billion, of the UK's total £7 trillion wealth.
The report puts the UK's total population at 62.9 million people (the latest ONS estimates say 63.7 million) or 48.2 million adults. So for the population in the bottom 20%, this works out at £2,240.43 per person (including children), or £2,935.15 per adult.
How rich are the richest?
The total wealth of the top five families in the Forbes billionaires list for the UK is $46.9 billion, or £28.18 billion: exactly the same as the wealth calculated for the poorest fifth of the population.
Both of these comparisons refer to wealth in terms of a balance at a point in time - not income. They also appear to measure slightly different things - the ONS data that the Credit Suisse calculations are based on state that they do not include business assets owned by household members (for example if they run their own business). The Forbes list state that they value individuals' assets - including stakes in public and private companies.
Incomes of top 0.1% have increased at a faster pace
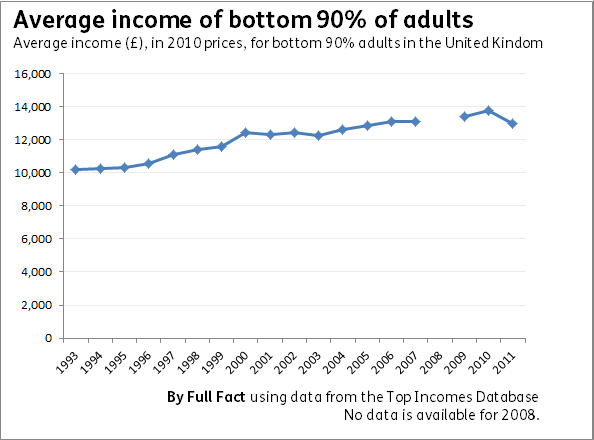
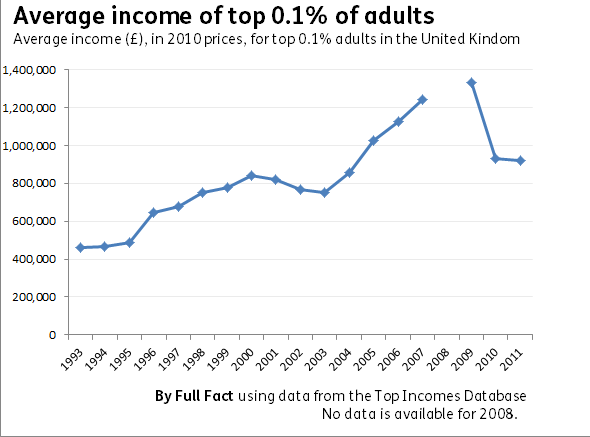
Oxfam use the Top Incomes Database to calculate how incomes have changed over time.
For the bottom 90% of adults, their average income has increased by 27%, from £10,200 in 1993 to £12,993 in 2011 (in 2010 prices). This works out at an increase of £146.99 a year.
For the top 0.1%, their average income has increased in real terms from £460,050 in 1993 to £922,433 in 2011 - which is an increase of 101% or £24,335.95 a year.
So while the claims reported in the papers can be traced to a number of different datasets, the exclusion of data on business asset ownership in the ONS figures raises questions over how comparable this data is with the Forbes list.
Updated 19/03/2014
This article was updated to note that the wealth per person figure for the 'bottom 20%' includes children.