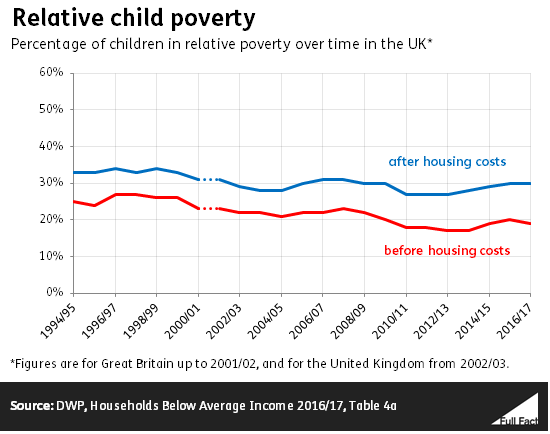
It’s correct that the number of children in relative poverty (after housing costs) increased over the three years to 2016/17 to 30% of children or 4.1 million.
Poverty in the UK is measured in two ways. Children in relative poverty are children in households where the income is below 60% of the median level for that year. The proportion of children in relative poverty has remained fairly stable over the past 20 years.
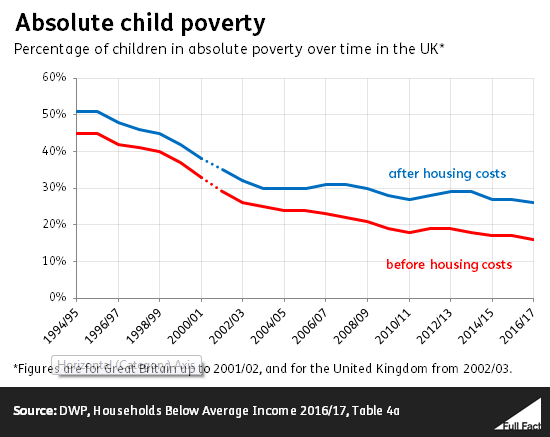
Poverty can also be measured in absolute terms—the number of children living in households with an income of 60% below a fixed amount (currently, the government uses the median household income from 2010/11 as that fixed point).
The median is the number 'in the middle' of a set—so half of all households earn more than the median income household, and half earn less.
On this measure, the number of children in absolute poverty (after housing costs) decreased from 2015/16 to 2016/17 by two percentage points to 26% or 3.5 million children.
We’re focusing here on poverty after housing costs have been removed, which is the data the claim referred to. There are some criticisms of this measure, as it could be argued that removing housing costs from the equation is a little arbitrary. Although housing takes up a large part of most people's budgets, other important costs are not afforded the same treatment. You can read more about this here.
The trends over time are similar whether you’re looking at poverty before housing costs or after housing costs, but the level of poverty after housing costs is higher than the level before housing costs.
Technically all these figures refer to people with “low incomes” but the data is widely referred to as describing poverty prevalence. The source of this data is the Family Resources Survey, and as with all surveys there is a margin of error with the results. The Department for Work and Pensions say that neither the increase in relative poverty nor the decrease in absolute poverty are statistically significant—meaning we can’t be sure if it’s a real world effect or because of the way the figures are collected.
Why do we have two measures?
There's been a long political debate around the value of relative and absolute measures of poverty. Neither measure is perfect, and sometimes they can tell quite different stories.
Relative poverty measures can lead to some odd outcomes. It seems counterintuitive that you could be 'lifted' out of poverty simply because people around you become poorer.
Absolute measures have their own disadvantages. They won't tell you if those at the bottom are falling even further behind those in the middle, and they won't take into account changes in what we see as the minimum acceptable standard of living.
A more general issue with these figures is that a low income doesn't necessarily imply a low standard of living. For example, people can sustain their living standards after a fall in income if they run down their savings.
The ONS uses the "60% of the median" benchmark to indicate whether someone is 'at risk of poverty'.
As the Institute for Fiscal Studies put it, absolute and relative measures tell us different things, and "there is nothing to be gained from ignoring some of this information". Considering both together paints a fuller picture. You can read more from us about poverty here.
What’s happened in the longer term?
Looking at year-to-year changes that are statistically insignificant doesn’t help us really understand the bigger picture. Over the past 25 years absolute child poverty (after housing costs) has halved while relative child poverty (after housing costs) is at roughly the same level (30% vs 33% in 1994/95).
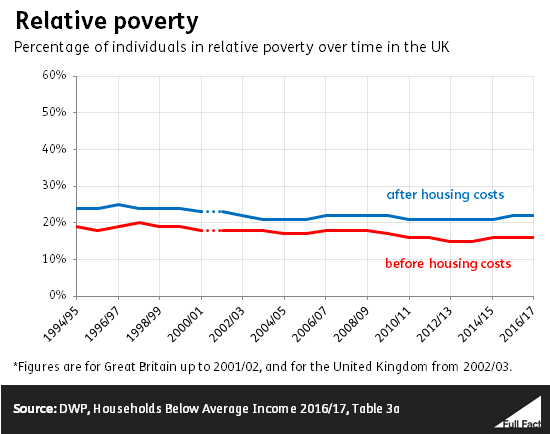
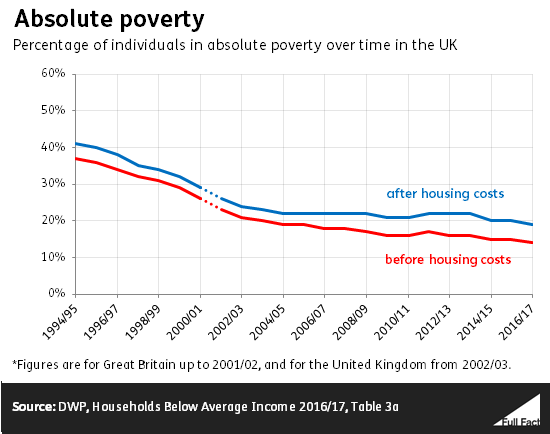
The trend for all UK people is very similar—absolute poverty has halved while relative poverty is at similar levels.