With local elections coming up in May, a Conservative party election advert claimed that Conservative councils save families around £100 a year more than Labour and Liberal Democrat councils.
We’ve heard the opposite claim from Labour which we wrote about here.
Labour’s claim was technically correct, but not meaningful. So is the Conservatives’ claim any more useful?
Essentially, no. The Conservatives’ calculations are flawed in three ways. Like the Labour claim, a fundamental problem is that in many councils it’s not possible to say that one party sets your council tax. Additionally, the “band D” rate used for calculating average bills is not a good method of comparison. And even with that, the averages are worked out incorrectly.
This makes their figure pretty much meaningless.
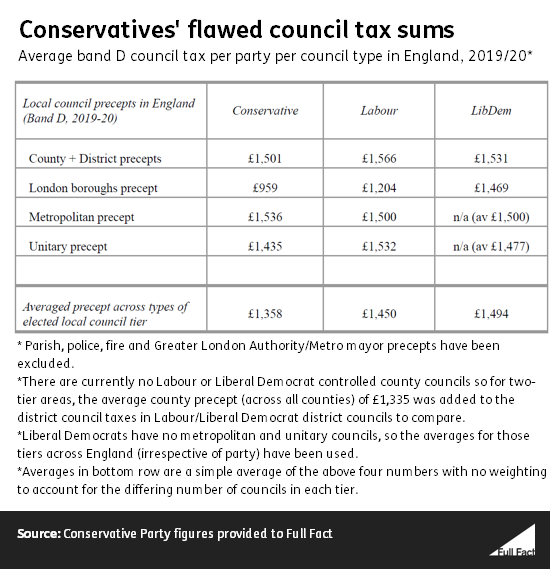
The Conservative party told us they calculated the average band D council tax in 2019/20 for each party, in each of the four main types of council structure (London borough, metropolitan borough, unitary authority and two-tier districts). So to work out the total average council tax bill for a party, they added up that party’s average bill in each of the four council structures, and divided it by four. If that sounds confusing, the table below illustrates what they did.
There are many reasons why this is bad.
Firstly, the average is worked out incorrectly, because it gives equal weight to each council structure.
To take an example, the Conservatives control six London boroughs, which make up 4% of the roughly 160 councils they control (excluding counties). Yet in their calculation, London Boroughs contribute 25% of average, meaning they are massively overrepresented. These six councils also have significantly lower bills than the average across other Conservative councils.
(They also did something strange to fudge the fact that the Liberal Democrats don’t actually control any unitary authorities or metropolitan boroughs — rather than work out the Lib Dem’s average based just on the two types of council they do control, they also included the England-wide average bills for the two types of council that the Lib Dems don’t control any of. So 50% of the Liberal Democrat “average” actually derives from council tax amounts set by other parties. The effect of this isn’t huge in practice; had they ignored the 50% of councils that aren’t Lib Dem-run, the average would have been £6 higher. But it’s still a bad way of producing these numbers.)
But the problems aren’t limited to flawed calculations.
You can’t always say which party sets council tax
Even if the Conservatives had done their averages correctly their numbers don’t tell us very much because of how they calculated the averages in county and district councils (the Labour party had a similar issue with their calculations). Explaining this requires a bit of background context.
In England there are, broadly, two main local government structures—single-tier and two-tier. In single-tier structures, one council is responsible for providing the majority of local government services, and collecting council tax. Single tier councils include London boroughs, metropolitan boroughs or unitary authorities.
In a two-tier system, you’ll have two main councils. The county council sets most of the tax and provides major services (like education, transport and social care.) Within a county area, separate district councils provide other services, like bin collections and housing, and collect council tax—both the relatively small amount for their own services, and the larger amount on behalf of their county council.
So in two-tier systems, the district council which collects your council tax isn’t setting most of that bill. Yet the Conservatives’ calculation assumes that in two-tier councils, all of your bill is set by the party controlling the district council.
Because almost all county councils are Conservative-run (and none are Labour- or Lib Dem-run), the Lib Dem and Labour averages for two-tier councils are actually overwhelmingly the result of Conservative county councils.
This is not to say that there is a perfect way to calculate average bills for each of the different parties. The issues with two-tier authorities make it very hard to make a meaningful comparison. But the Conservative’s method is a flawed approach.
Comparing Band D tax rates can also be misleading
Putting aside the problems with how the Conservatives calculated their figures, there’s a broader problem with them using “band D” tax bills to calculate their averages.
Within each English council area, council tax will vary depending on the value of your home. Homes are valued on a national scale from band A (the cheapest homes) to Band H (the most expensive).
Historically, the standard way to compare council tax costs across different councils has been to look at the average bill for a two-person household in a band D home. This is because it compares a similar type of home in any given council.
But this approach often doesn’t accurately tell us about bills for most residents, because two-thirds of homes in England are in bands A-C. So a band D bill is above-average.
And councils with similar average council tax bills for all eligible residents can have very different “band D” rates.
Consider the councils of Darlington and Southend-on-Sea, which charge very similar council tax (averaging £1,200 and £1,204 respectively per dwelling ).
But Darlington’s band D charge (excluding precepts set by other authorities) is £1,506 while Southend’s is £1,382. So while Darlington actually charges an average of £4 less per dwelling than Southend, its Band D rate is £124 more.
That’s partly because, in Darlington 80% of homes are below Band D while in Southend it’s 69%, and the formula for setting council tax bills is based on the number of Band D homes in an area. It’s quite complicated, but in short: while both councils need to collect roughly the same amount of money per household, the band D rate is higher in Darlington because these homes are essentially counterbalancing the lower tax on cheaper homes to a greater extent than in Southend.