The ever-changing past – constructing and revising GDP data
GDP—‘Gross Domestic Product’—is the main measure of the size of the economy.
We've looked into how it's calculated, and why the figures are so often revised.
Join 72,547 people who trust us to check the facts
Subscribe to get weekly updates on politics, immigration, health and more.
Statisticians measure GDP in three different ways
GDP can be measured based on what are known as the output (what we produce), income (what we earn) and expenditure (what we spend) approaches.
But it doesn't measure all three at the same time. The quickest method is to measure output, which is done by sending out surveys to thousands of businesses who send back information about their turnover. From this, the Office for National Statistics (ONS) can make a 'preliminary' estimate for the whole economy about 25 days after the three-month period they're testing is over.
To an extent, this is 'nowcasting' (as the ONS itself terms it): an effort to get the best possible snapshot of the direction of travel for the economy by filling in the blanks for industries which haven't yet returned complete data with estimates.
For these reasons, the ONS needs to publish revisions to GDP on a regular basis. So along with preliminary estimates, there are second estimates, quarterly national accounts and the annual Blue Book, as well as occasional general changes, each of which uses progressively more data and includes the income and expenditure measures of GDP too, giving us a fuller and more accurate picture.
These other measures are also collected through surveys and administrative data.
All three measures of GDP have to come to the same total. Any differences between the measures are balanced out by using what is called an ‘alignment adjustment’.
What you thought was true? Never really happened…
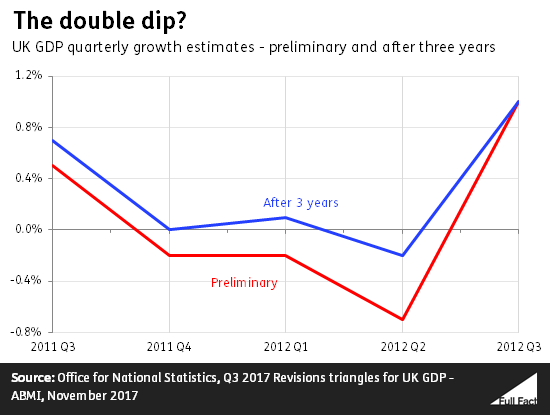
The most glaring recent example of this was the 2011 to 2012 'double-dip recession' as it was called, when GDP was thought to have fallen for at least two successive quarters for the second time in recent history.
Except it didn't. As the ONS got more data and refined its calculations, it found the economy didn't dip as much as it had been thought from its preliminary estimates. The differences in economic terms were minor: the biggest revision was of 0.5 percentage points (for the second quarter of 2012). But in political terms, coming in at either side of the zero line can be huge.
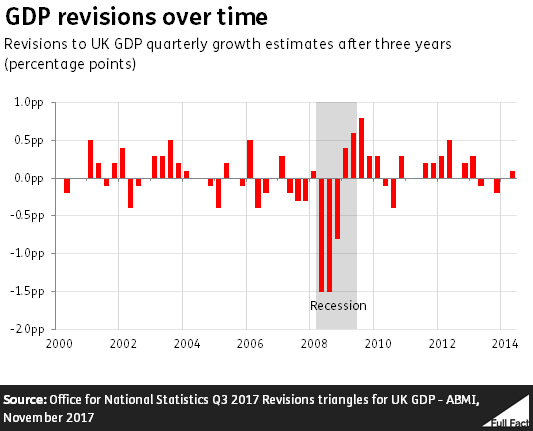
Still, while preliminary estimates are usually revised, they don't tend to be changed by more than a few tenths of a percentage point either way. Revisions made after three years are sometimes slightly larger. Between January 1993 and June 2014, the absolute average revision after three years was 0.25 percentage points.
An exception to this was during the height of the financial crisis in 2008 and 2009 GDP estimates for this time were revised down by around 1.5 percentage points after three years, meaning that the recession was deeper than originally estimated.
Some have questioned GDP's value as the 'be all and end all' measure of the economy's health.
There was a great deal of discussion in 2012 when poor GDP figures jarred with lower unemployment figures, suggesting that using the growth measure alone didn't give the full picture. In addition, and as we've highlighted before, expectations can play as much a role in stimulating confidence as actual hard figures from the ONS.
There are also some aspects of the economy that GDP doesn't necessarily measure. For example:
- It doesn’t capture some aspects of people’s wellbeing or everyone’s experience of the economic situation.
- It doesn’t reflect the environmental impacts of economic growth, such as pollution
- It excludes unpaid work, such as housework and childcare.
- It may not be accurately capturing improvements in digital technology, or the value of digital services provided for free.