Disability benefits, homelessness, and payments to the EU: Prime Minister's Questions, factchecked
Join 74,000 newsletter subscribers who trust us to check the facts
Sign up to get weekly updates on politics, immigration, health and more.
Subscribe to weekly email newsletters from Full Fact for updates on politics, immigration, health and more. Our fact checks are free to read but not to produce, so you will also get occasional emails about fundraising and other ways you can help. You can unsubscribe at any time. For more information about how we use your data see our Privacy Policy.
Disability benefits
“We will continue to increase spending on disability benefits, which will be £46 billion, more than £46 billion a year by the end of this parliament, compared when £42 billion when I became Prime Minister.”—David Cameron
This is about right, but spending is forecast to go down from this year, after adjusting for rising prices.
There are a variety of benefits for people who are disabled or incapable of work and different combinations of these have at times been referred to as ‘disability benefits’.
Spending on all benefits connected to disability and incapacity for work was £42.3 billion in 2010/11, adjusted for rising prices. It will be £48.6 billion this year and £47.4 billion by 2019/20, now that the government has dropped its budget proposals to reduce the amount spent on the Personal Independence Payment (PIP).
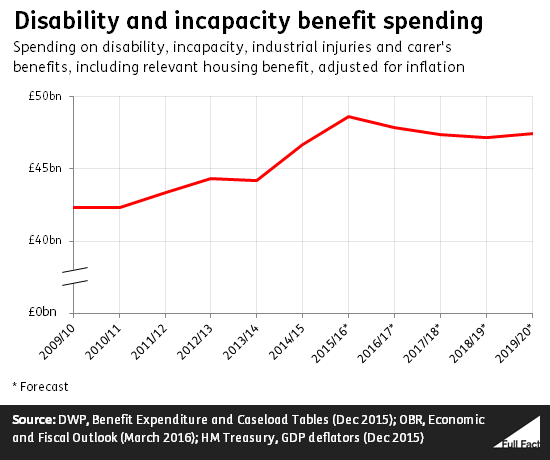
It would have been £46.5 billion if those changes had been made. That’s based on new forecasts from the Office for Budget Responsibility, combined with existing information from the Department for Work and Pensions.
The picture is broadly the same no matter which benefits you include. Spending rises between 2010/11, when David Cameron became Prime Minister, and the current financial year, before levelling off or dropping by the end of the parliament.
Spending on just PIP and Disability Living Allowance will increase slightly from now until 2019/20, but not by as much as it has been.
If the government had gone ahead with its plans to change PIP, total spending on these two benefits would have fallen.
This doesn’t tell us about spending per head. We don’t know what that is across all the benefits included in the chart above, which includes housing benefit paid to disabled people, for example.
But for Personal Independence Payments and Disability Allowance specifically, spending per person will rise by 17% between 2009/10 and 2019/20. The rise is smaller (6%) looking just at the next few years. That’s based on forecast expenditure again, and the number of people expected to claim.
Homelessness
“Government figures published only this morning show the number of people with disabilities and who are homeless is now up by 39% since 2010.”—Jeremy Corbyn
“He referred to... the regrettable rise in homelessness, with figures out today, but homelessness is still 58% below the peak that it reached under Labour.”—David Cameron
These figures are all correct according to official statistics on households legally considered homeless in England.
4,000 households with at least one disabled member were counted as homeless and entitled to help by local authorities at some point in 2015, up 39% since 2010. That’s counting physical disabilities only.
Homelessness rose faster for these households than for others. In total there were about 57,000 officially homeless households recorded during 2015, up 33% since 2010. As the Prime Minister says, this is 58% lower than the 2003 peak of 136,000.
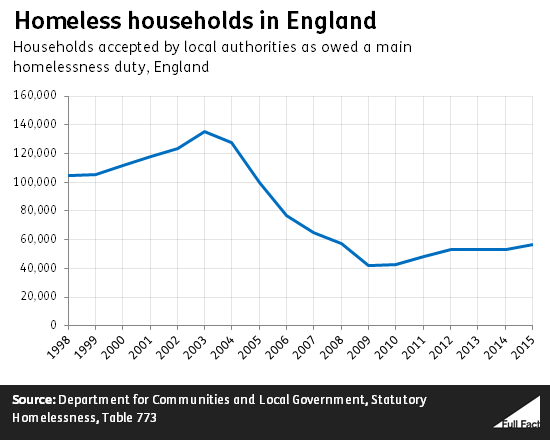
The number of people applying for help in the first place is also down by around the same percentage since 2003, while the rise in applications since 2010 is smaller than acceptances (17%).
Being legally homeless doesn’t necessarily mean people are sleeping rough. For instance, people who face violence or abuse, or have homes in very poor condition, or simply can’t afford to stay where they are, can all be classed as homeless.
On the other hand, these figures don’t include those who were assessed as “homeless but not in priority need” and so not entitled to help from the council. There are around 20,000 such cases a year. Nor do they include 9,000 households where people were deemed to have made themselves homeless.
Contributions to the EU
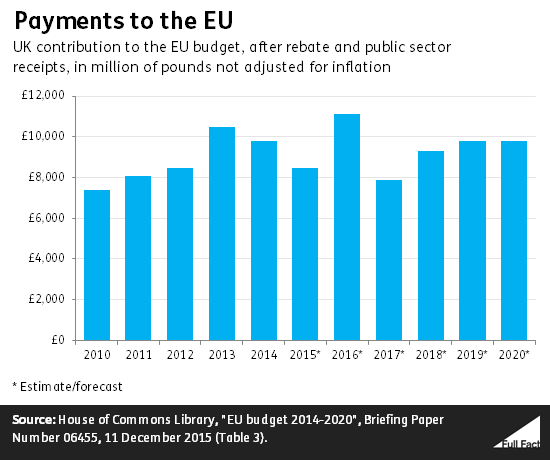
“The House of Commons Library confirms that this year our net contribution to the EU will increase by more than £2.6 billion. I think it is actually two thousand, six hundred and twenty seven million pounds.”—Peter Bone MP
This is exactly right, though our EU budget contributions change a lot from year to year. Next year’s drop is forecast to be bigger than this year’s rise.
The difference between what the government pays into the EU and what comes back in EU spending will rise from £8,473 million in 2015 to £11,100 million in 2016, according to the House of Commons Library. That’s up by £2,627 million, as Mr Bone says.
These numbers aren’t set in stone: they ultimately come from forecasts by the Office for Budget Responsibility.
And the spending increase in 2016 is more than matched by a fall in 2017, according to these forecasts.
The net contribution doesn’t quite capture the potential financial savings from leaving the EU. On top of ‘public sector receipts’, the EU also gives a significant amount—£1.4 billion in 2013—directly to the private sector, for research grants in particular. But most of the net contribution will ultimately be spent in other EU countries.
“Our net contribution accounts for just over one penny in every pound paid in taxes”—David Cameron
This is also correct. The government collected £655 billion in taxes and other income in 2014/15, whereas net contributions to the EU were £8.8 billion. That’s 1.3%, or a penny for every pound.
Looked at another way, the government will spend a forecast £754 billion this year, of which EU expenditure after money comes back will be £10.5 billion. That’s 1.4% so, again, a penny in the pound.