Households are £900 worse off due to increased energy bills since 2010.
Our verdict
That's adding up the increase in average electricity and gas bills in each of the six years from 2010 to 2016 (adjusting for inflation) if energy use stayed the same over this time. It hasn't. The Committee on Climate Change has said that household bills in 2016 were lower than they were in 2008, due to reductions in energy use.
“Over and over they’ve promised to get bills down but under them households are almost £900 worse off due to increase[d] energy bills since 2010.”
The figure is correct based on official data, but doesn’t mean what you might think at a glance. The Committee on Climate Change has said that household bills in 2016 were lower than they were in 2008, because of reductions in energy use.
Labour isn’t saying that annual energy bills have increased by £900 since 2010. It’s a cumulative total—adding up the increase in prices in each of the six years from 2010 to 2016 (adjusting for inflation).
The figure doesn’t distinguish between bills for different tariff types or payment methods. It's also based on households using the same amount of energy over the period, but energy efficiency has reduced average household energy consumption in recent years.
Join 72,547 people who trust us to check the facts
Subscribe to get weekly updates on politics, immigration, health and more.
Calculating the average energy bill
We all use all different amounts of energy. What we pay will depend on how much we use, what tariff we are on, and how we pay our bills.
Labour told us the figure is based on the government’s estimated average household energy bills, using a set amount of gas (15,000 kWh a year) and electricity (3,800 kWh) consumption a year. So these estimates don't account for changing household consumption.
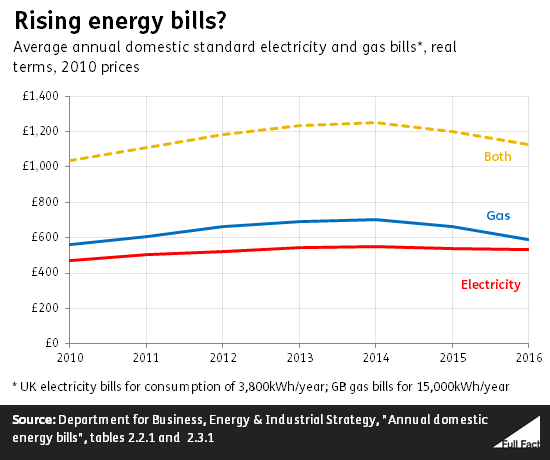
Adding up the total additional money paid on average for the same amount of gas and electricity between 2010 and 2016 produces an increase of £883 over the period, taking inflation into account. This tells you how much extra, in total, the average consumer might have paid for electricity since 2010, compared to what they would have paid if prices hadn’t risen above inflation.
Energy prices rose and then fell over this period.
The government itself doesn’t calculate a combined figure for these bills. This is because the figure for the electricity bill covers the UK, which includes Northern Ireland, while the gas bill figure covers Great Britain (England, Scotland and Wales only). So it’s probably better to look at them separately.
Does this mean that we’ve all paid £883 extra?
There are significant variations in what customers pay for the same energy usage.
If your energy consumption did match the one used for the calculation, you’re on a standard variable tariff and you don’t pay by direct debit, the figure is likely to be higher.
If you always shop around, and make sure you get the best deal every time your contract ends, and pay by direct debit, the figure is likely to be lower.
Energy regulator Ofgem found that in 2016 the difference between the cheapest tariffs and standard variable tariffs was £300 a year and that 66% of customers were on these more expensive standard variable schemes. It has also estimated that 45% of people don’t ever remember switching supplier and that if they did they could save on average £200 a year.
As an example, the latest Ofcom figures for April 2017 show that customers on a standard variable tariff with the ‘big six’ energy suppliers were paying £1,086 on average. However the cheapest available tariff for the same usage from the big six it was £937 and for all suppliers it was £834. These figures are based on a lower energy usage than used for the government’s estimates and are for dual fuel customers paying by direct debit.
Domestic customers on standard variable tariffs have been paying about £1.4 billion a year more than they would in a properly competitive market according to a 2016 Competition and Markets Authority investigation. It proposed a database of customers who haven’t changed suppliers for three years, so that other suppliers can contact them with their offers.
Does this mean that companies made £833 extra per customer?
The head of Ofgem’s view is that costs are the main driver of energy prices. He told MPs there had been a 15% rise in energy supplier costs at the end of 2016 compared to 2015. Of that, 12.5% was due to the rise in wholesale prices and 2.8% was due to government costs. However these figures don’t reflect all the costs to suppliers, such as the smart meter roll-out.
The latest Ofgem figures of the components for a dual fuel bill are:
Wholesale energy prices, which is the cost of buying energy to suppliers: 43%
Network costs, which cover the costs of maintaining, upgrading and operating the energy grids: 24%
Company operating costs: 16%
Environmental/social obligation costs: 7%
VAT: 5%
Supplier pre-tax margin: 4%
Other direct costs: 1%
Update 7 June 2017
We added in the findings from the recent Committee on Climate Change report to the conclusion and the introduction of the piece.