Freedom of information reveals who wins and loses in 2013
Last month the Chancellor George Osborne boldly announced:
"This month, 9 out of 10 working households will be better off as a result of the changes we are making... And the average working household will be better off by over £300 a year."
It came in a speech to Morrisons staff at the outset of a swathe of policy changes which began to be implemented last month, including the rollout of Universal Credit to replace a series of benefits, Personal Independence Payment (PIP) replacing Disability Living Allowance, a cap on the increase and total benefits working-age people are entitled to, and an increase in the income tax personal allowance.
At the time, Full Fact attempted to factcheck the 9 out of 10 figure to no avail. The Treasury neither published nor disclosed details of how the figure was arrived at.
Now, one month on and one freedom of information request later, we've managed to get hold of the figures. So:
How do they get such a figure?
According to the Treasury, the figures come from the 'lntra-Governmental Tax Benefit Model (IGOTM)' which to you and me is a computer program the government uses to simulate the tax and benefit system, fuelled by data from the Office for National Statistics' Living Costs and Food Survey and other household studies.
This means the Treasury is able to adjust whatever levers it so chooses to project who's better off and who's worse off as a result of a policy change - exactly what happens every year at the Budget. It isn't publicly available, so if the government doesn't choose to publish details, a freedom of information request is the only way to get hold of them.
What changes are we talking about?
The Treasury made clear to Full Fact that only certain policy changes were being factored in because not all new measures could be modelled robustly. The policies factored into the analysis are:
- Increasing the personal allowance by £1,115, along with changes to the Basic Rate threshold
- Freezing age-related income tax allowances
- Giving a 1% grant for a 2013/14 council tax freeze
- Postponing the April 2013 fuel duty increase until September 2013
- Increasing working age benefits and tax credits by 1%
However these policies were left out:
- The £26,000 household benefit cap
- Reform of Disability allowances gateway
- 10% reduction in Council Tax Benefit expenditure
- Lowering the additional income tax rate to 45p
- Limiting working age social entitlements to reflect size of family from 2013/14
Full Fact asked the Treasury whether excluding these measures would significantly alter the results of such an estimate, to which they replied:
"Even under the most extreme assumptions, including the measures mentioned above would not make any significant difference to the number of working households gaining from the Government's measures in 2013-14."
Who wins, who loses?
For working households, The nine out of ten statistic comes from the calculation that 14.2 million households gain overall and 1.7 million households lose out, so out of 16 million in total, about 90% are net gainers. A breakdown of the number of households gaining or losing is shown below:
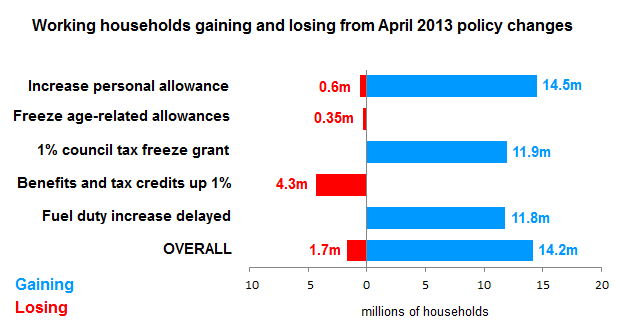
(The losses due to the 'personal allowance' are where individuals earn more than £100,000 and lose out from changes to the basic rate income tax threshold that comes as a package with the allowance increase.)
However not all these households materially gain or lose the same amount. The average gains and losses were also provided:
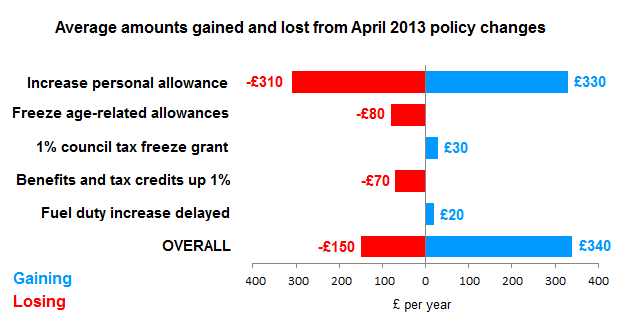
So it's correct to say that nine out of ten working households will have benefited from the policies modelled by the Treasury.
It's important to remember that these figures take the April changes in isolation. The Institute for Fiscal Studies has already calculated that most income groups are worse off financially as a result of tax and benefit reforms since 2010, and projecting to 2015.
But what about all other households?
That's where the somewhat rosy picture ends. Full Fact was informed that, through the model, 700,000 non-working households would gain overall from the policy changes by an average of £170. However, 2.4 million workless households would lose out on average by £80 in 2013/14.
Across all households in the UK, 17 million are estimated to gain by an average of £310 a year. Conversely, 7 million lose out by £90 on average in 2013/14.
In other words, if we take out the "working" from Chancellor Osborne's nine out of ten claim, the result is that seven out of ten UK households are better off as a result of the Government's changes last month.
It's unfortunate the Treasury were unwilling to make this detail available a month ago, so that the public could have understood more fully what was meant when he made the claim.