Has Labour ever left office with lower unemployment than it started with?
"My right hon. Friend is factually correct: every Labour Government have left office with unemployment higher than when they came to office."
David Cameron, Prime Minister's Questions, 2 April 2014
"No Labour government has ever left office with unemployment lower than when it started, despite the name of the party."
The Times (£), 7 April 2014
Last week's Prime Minister's Questions put the spotlight on the unemployment performance of previous Labour governments, a claim which was repeated in a Times article today.
Official figures for the unemployment level and rate back up the claim for the last two Labour governments (Tony Blair/Gordon Brown and Harold Wilson/James Callaghan), while less reliable administrative data finds the trends continue back to the 1929 Labour government.
While the figures we do have back up the claim, some Conservative governments have also left office with higher unemployment, including their most recent complete stint in office up to 1997. As well, looking at trends within each period can show more of a changing picture of unemployment.
Increase in unemployment level and rate
The main measure of unemployment in the UK is provided by the Labour Force Survey (LFS).
Unlike the claimant count which just measures those claiming out of work benefits (and which can be affected by policies for those out of work), this measure is based on a regular household survey of economic activity. It calculates the unemployment rate by the numbers who are economically active (so those who are in work or seeking work).
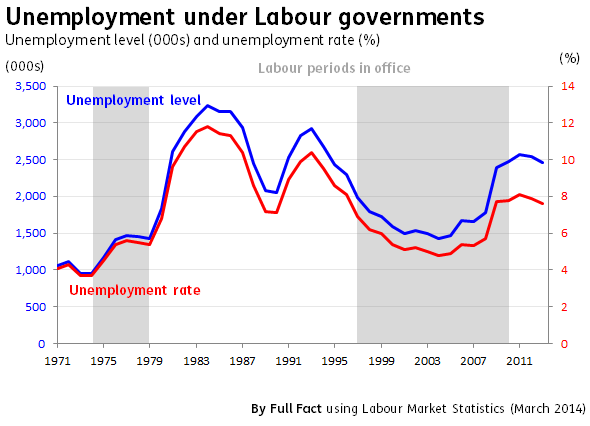
Taking the annual figures (available back to 1971), the claim holds true for both the Harold Wilson/James Callaghan-led Labour Government of 1974 to 1979 and the period of New Labour from 1997 to 2010 - both are shaded grey in the graph below.
This is true when looking in more detail at the statistics which come out every three months.
Comparing roughly the election periods of Oct-Dec 1974 to Mar-May 1979, the unemployment level increased from 976,000 to 1.4 million and the rate increased from 3.7% to 5.3%.
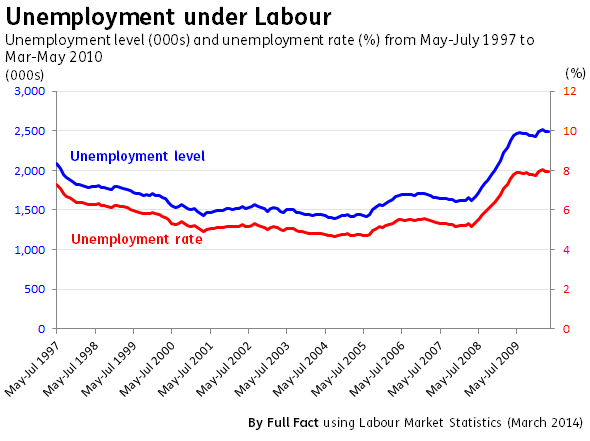
Taking May-Jul 1997 to Mar-May 2010, the unemployment level increased from 2.1 million to 2.5 million and the rate increased (albeit a smaller increase this time) from 7.3% to 7.9%.
Of course, both of these governments ended in an economic downturn - the first starting in 1979 and the second in 2008/09. But we've discussed previously how unemployment levels can be seen as a 'lagging factor' and may not show the full effects of a downturn until a recession has ended.
As we might expect, looking just at the start and end of Labour's previous stint in office hides the falling unemployment trend during their first two terms.
Historical data reveals similar trends
Administrative sources can provide data for unemployment back to 1881, based on people who have registered with a government office as being unemployed.
The Labour Market Statistics Group published this data in a Labour Market Trends bulletin in 1996.
But, these statistics come with a major caution. They note that:
"the range of social and legislative changes which have occurred over the years, and their effect on the definition and coverage of the unemployment statistics, preclude the possibility of these figures being treated as one continuous, comparable series".
So these figures should be viewed with a serious health warning.
The shaded areas below show the various periods of Labour governments since 1922 - with all but one showing the level and rate of unemployment higher at the end of the term.
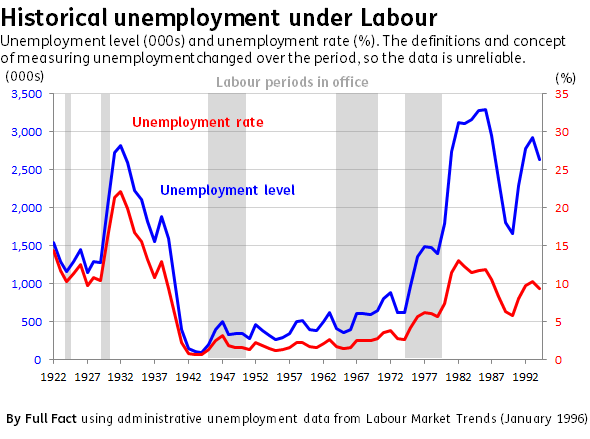
The 1924 minority Labour government (January 1924 to October 1924) bucked the trend, with the unemployment level decreasing - on this measure - slightly from 1.32 million to 1.29 million and the rate decreasing from 11.9% to 10.9%.
Still, by looking at just the record of previous Labour governments ignores the fact that the same trend can be seen in some previous Conservative governments. For example, taking figures for the Thatcher-Major Conservative period in office from the LFS, unemployment increased from 1.4 million at the end of 1979 to over two million in 1997, and from a rate of 5.3% to 7.2%.