In a recent Prime Minister’s Questions, Jeremy Corbyn made the claim that, of the ten most deprived council areas in the country, nine had seen cuts three times greater than the average for other councils across the country.
The data the claim is based on can’t be compared in this way, so it’s not possible to reach the figures Mr Corbyn was quoting. But analysis from the National Audit Office does show that all ten councils Mr Corbyn was referring to have seen their funding reduced by a larger proportion than funding has reduced by in total, across England.
Overall, councils in deprived areas in England have seen greater reductions in their budgets since 2010 than less deprived ones.
We asked Labour for more information about the claim and it told us the “most deprived councils” are based on a measure called the Index of Multiple Deprivation. This ranks areas in England based on how deprived they are across a range of different measures: income, employment, education, skills and training, health and disability, crime, housing and living environment.
Using this measure the most deprived council areas in England (at local authority district level) are Blackpool, Knowsley, Kingston upon Hull, Liverpool, Manchester, Middlesbrough, Birmingham, Nottingham, Burnley and Tower Hamlets. This data is from 2015, and is the most recent available.
Labour also told us that it used a measure called ‘core spending power’ per household to work out how funding in these councils had reduced between 2010/11 and 2019/20. Core spending power is a measure which includes “the main streams of government funding to local authorities”, money the council gets from council tax and business rates, and some other funding.
However, the problem is that changes in core spending can’t be compared like this over a decade, because the ‘core spending power’ measure has changed significantly. Each year, the set of grants that councils receive from government can change, as well as the responsibilities councils have and the things they spend money on. There have also been changes in how the data is reported.
Because the ‘core spending power’ measure changed each year, the government produced an ‘adjusted’ figure to account for this. This is basically to show what spending in the previous year would look like, if the present year’s grants had been given the year before. That means we could in theory compare spending in, for example, 2010/11 with spending in 2011/12 on a broadly equal basis.
But the government hasn’t adjusted every year to create a time series, so the figures are only comparable with the year immediately before it. That means we can’t compare the core spending power figure in 2010/11 with 2019/20 in the way Labour has. From 2015/16 onwards the government does publish a consistent time series so it’s possible to compare these years, but again not with any years before that.
But there are other ways to look at the numbers
There are ways that these figures can be compared however. The National Audit Office produced a report in 2018 which ‘weighted’ the core spending power data to make it comparable over time.
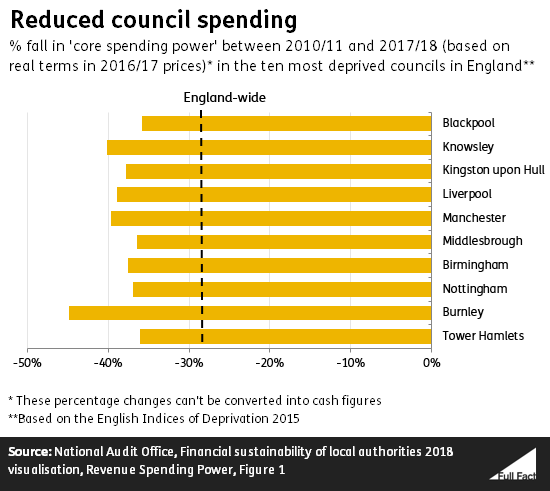
Using this measure we can see the reduction in core spending power across all ten councils with the greatest levels of deprivation was greater than the reduction in spending across England as whole (where it was 28.6% over the eight years).
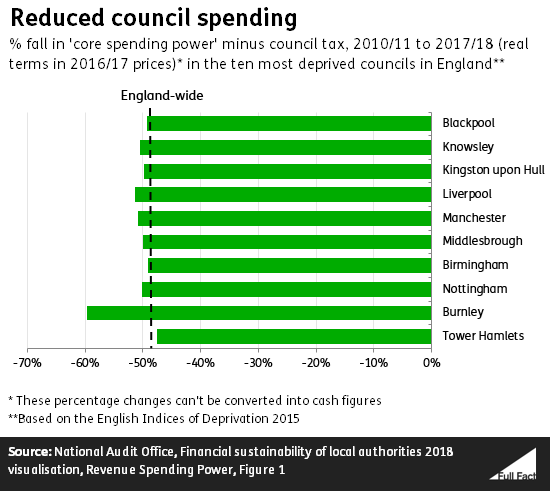
It’s also possible to discount revenue raised through council tax from the figures. Doing this demonstrates how more deprived councils are less able to raise money locally through council tax, and so more dependent on money from central government.
If you discount council tax revenue, these councils are all much closer to the national reduction in spending power—49.1% over the eight years—with the exception of Burnley which has seen greater reductions. By 2019/20 this reduction is forecast to total 56.3%.
Deprived councils have seen larger funding reductions
Despite the fact that the data Mr Corbyn’s claim is based on isn’t comparable over time, the underlying point he seems to be making is broadly correct, as the data above shows.
Analysis from the Institute for Fiscal Studies (IFS) has also found that more deprived councils have, on average, seen larger reductions in their funding than their less deprived counterparts. Measures introduced to allow councils to raise more money locally, through council tax and business rates, have also had less benefit for more deprived councils.
The IFS has also said: “it is the councils most dependent on central government support—typically those in poorer and more urban areas—that have suffered much the biggest spending cuts. We have stopped redistributing so much from better-off to less-well-off areas. That said, it does seem to be some of the shire counties, which have suffered smaller cuts but started with less in the first place, that are struggling most.”
The NAO says that different types of councils have seen different levels of impact on their finances over the eight years, but the reductions would be “proportionately greater” for councils that depend more on government funding than council tax for spending power. It says “As a consequence, authorities that are relatively more grant-dependent, such as metropolitan district councils, have had greater reductions in their overall spending power.”