Hollow records, selective reporting and dubious trends: the employment debate
OPINION: Yesterday the latest employment and unemployment figures were released by the Office for National Statistics (ONS). It's a regular monthly release which never ceases to make headlines for even the slightest bump or dip in the key employment indicators.
Yet an arena for quality debate it is not. Government and Opposition both present the figures in ways that only the canny can keep up with.
Hollow records
PM, January: "There are now more people employed in the private sector than ever before, and there are also more women employed in our country than ever before."
Join 74,000 newsletter subscribers who trust us to check the facts
Sign up to get weekly updates on politics, immigration, health and more.
Subscribe to weekly email newsletters from Full Fact for updates on politics, immigration, health and more. Our fact checks are free to read but not to produce, so you will also get occasional emails about fundraising and other ways you can help. You can unsubscribe at any time. For more information about how we use your data see our Privacy Policy.
PM, March: "We have seen more people in work than ever before, including a record number of women."
Deputy PM, May: "More people are employed in the private sector than ever before, employment has risen by 866,000 since the election, and the number of women employed is the highest that it has ever been."
DWP, June: "Private sector employment hits new record high... The figures from the Office of National Statistics show that more people are in work than ever before"
Claims like this are commonplace, and they are all meaningless. As a means of evaluating the Government's record, we shouldn't care about the number of people or women employed in the economy. The UK population is almost always increasing and, to an extent, more demand for services and more jobs are expected consequences of this. As a result, we've seen a new record set for the number of people in employment in every year between 1995 and 2007, with the only interruption to this trend coming during the two periods of recession that book-end this period.
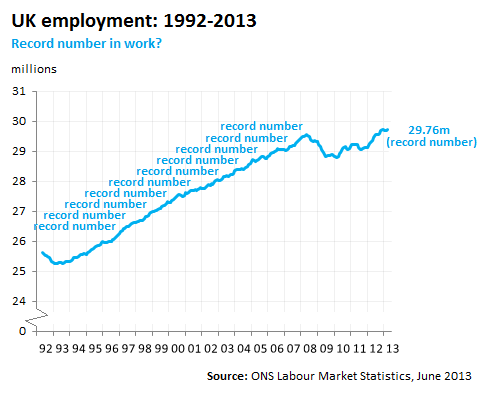
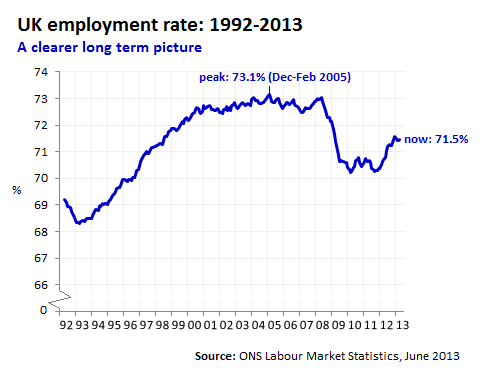
What we should look at is the employment rate - the number of working-age (16-64) people in work as a proportion of everyone aged 16-64. This effectively filters population growth out of the equation.
The same applies for women. Full Fact has discussed this point before - there are indeed a record number of women (13.85 million) in work. But there are also near-record levels of women unemployed - 1.1 million (the peak was 1.3 million towards the end of 2011).
Selective presentation
Obviously people expect governing and opposition parties to present different arguments on the key issues of the day. But too often coherent argument is displaced by oblique references to fickle indicator-hopping from one to another as circumstances require.
Every time Labour Market Statistics are published by the ONS, there are corresponding press releases from the DWP and the Labour Party. Examining both sets since January illustrates the phenomenon of 'indicator hopping'.
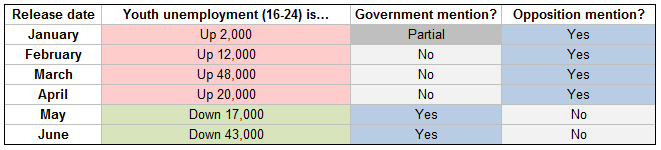
Youth unemployment (16-24) and long-term unemployment (out of work for over a year) are prime examples. Youth unemployment was rising at the end of 2012 but so far in 2013 it's been falling. Yet while the opposition reported on the trend up until the trend changed in 2013, they've been silent on the measure since. Meanwhile, the Government's own press releases have followed almost exactly the opposite pattern.
Dubious trends
Yesterday the DWP reported that: "There are 1.3 million more people in private sector jobs than in early 2010". Similarly, the Prime Minister stated in Parliament: "Under this Government, there are 1.25 million more private sector jobs."
Yet reading Stephanie Flanders' BBC blog, you'd have been told that: "There has now been a 6.8% (nearly 1.6 million) increase in private sector employment since the first quarter of 2010". The economist David Blanchflower took exception to this on Twitter, claiming the increase was just 1.043 million.
Who's right? A quick look at the relevant tables from the ONS on public and private sector employment reveals why everyone's in disagreement. Further Education Sixth Form College Corporations were reclassified from public to private sector last year, resulting in a boon for private jobs figures right in the middle of the dataset we're counting (and a corresponding drop in the public sector employment figures).
Not only that, but it's not actually clear what people mean when they say "since the election". The ONS data on private sector employment is only published quarterly - in March, June, September and December each year. A May election doesn't fit neatly into the series.
If we include the FE colleges and 6th form corporations in the private sector figures prior to 2012, we can get a reasonably comparable picture over time. So we have two alternatives: there are 1.3 million more private sector jobs since March 2010 and 1.04 million since June 2010.
Neither David Cameron's 1.25 million (comparing since June 2010) or Stephanie Flanders' 1.6 million (comparing since March 2010) are adjusted to take into account the reclassification. In other words, they're comparing a 2010 private sector without FE/6th form corporations to a 2013 private sector with those included.
Confused? We sympathise.
Employment statistics from the ONS are a treasure trove of information where users can - and do - choose from a huge number of indicators and timeframes in order to help judge the performance of the economy and their government's handling of it. Without statistics, we'd be left fumbling in the dark unsure of what the economy is doing.
But when faced with dubious claims highlighting meaningless 'records', with each side of the argument constantly switching from indicator to indicator, and with different figures apparently describing exactly the same thing, it can feel a lot like standing in the dark being hit over the head with a torch.