What was claimed
Home ownership is on the rise.
Our verdict
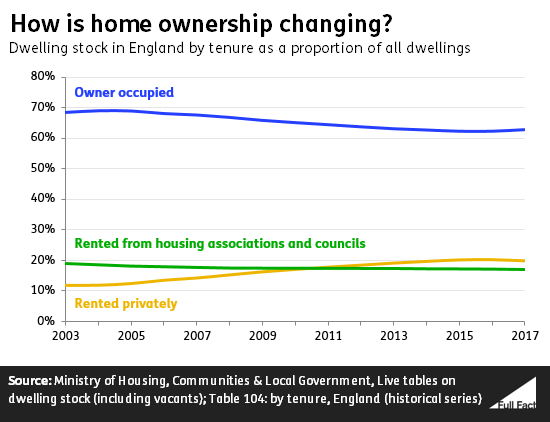
Correct over the last year in England. The proportion of homes owned by the occupier increased by 0.5 percentage points between 2016 and 2017. This follows year on year falls since 2004.
What was claimed
Home ownership is on the rise.
Our verdict
Correct over the last year in England. The proportion of homes owned by the occupier increased by 0.5 percentage points between 2016 and 2017. This follows year on year falls since 2004.
“Home ownership is on the rise.”
Conservative party, 25 May 2018
The proportion of homes in England that are owner-occupied, rather than rented, rose from around 62% in 2016 to about 63% in 2017. This follows year on year falls since 2004.
Over the same time period the proportion of privately rented homes has risen from 12% to 20%.
The proportion of socially rented homes has fallen from 19% in 2003—the earliest comparable figures— to 17% in 2017.
Housing is a devolved area, and figures for 2017 aren’t available for Scotland and Northern Ireland. In Wales, there was no change in the proportion of homes that were owner-occupied between the last two years.
Using another measure, which looks at the proportion of households owning their own home (which is slightly different) one survey estimates that the proportion of households owning their home increased in each UK nation from 2016 to 2017.

Join 72,953 people who trust us to check the facts
Sign up to get weekly updates on politics, immigration, health and more.
Subscribe to weekly email newsletters from Full Fact for updates on politics, immigration, health and more. Our fact checks are free to read but not to produce, so you will also get occasional emails about fundraising and other ways you can help. You can unsubscribe at any time. For more information about how we use your data see our Privacy Policy.
This data comes from the Ministry of Housing Communities and Local Government (MHCLG), and estimates the proportion of homes that are owned by the occupier, not the proportion of households who own their home.
For example, if the number of second homes owned was increasing, more homes would be owned by the occupier. But the number of households owning their own home would be the same.
We’ve written more about second home ownership here.
However there are other data sources available that measure the proportion of households owning their own home, such as the English Housing Survey and the Labour Force Survey. The latter also covers the whole of the UK.
Figures from the Labour Force Survey give a very similar picture, estimating that in the last quarter of 2017, 65% of UK households owned the property they lived in, up from 64% a year earlier. It shows a rise in ownership in each of the UK nations.
The English Housing Survey doesn’t have quite as recent figures, and so doesn’t report a rise in home ownership in England in 2016/17 compared to the year before. It found that the proportion of households owning their own home has been flat since 2012/13. Around 14 million households (or 63%) were owner occupiers in 2016/17.
MHCLG told us that shared ownership schemes are included in the dwelling stock figures for owner-occupied households. This is where the occupier owns a portion of their home (e.g. 25%) and pays rent for the portion they don’t own.
However the Labour Force Survey counts these households separately and estimated almost no change in the proportion of households in England in shared-ownership homes from 2016 to 2017. There was no change at a UK-wide level.
Correction 14 June 2018
We corrected the conclusion of this piece to clarify that home ownership increased by 0.5 percentage points rather than by 0.5%.
Full Fact fights for good, reliable information in the media, online, and in politics.
Bad information ruins lives. It promotes hate, damages people’s health, and hurts democracy. You deserve better.
Subscribe to weekly email newsletters from Full Fact for updates on politics, immigration, health and more. Our fact checks are free to read but not to produce, so you will also get occasional emails about fundraising and other ways you can help. You can unsubscribe at any time. For more information about how we use your data see our Privacy Policy.