A brief introduction to housing issues
- UK house prices have more than trebled in the past 20 years (ONS basis)
- Fewer under-25s are buying homes, while houses are more expensive for first-time buyers relative to their incomes
- Social housing waiting lists have risen, and rents are becoming more expensive
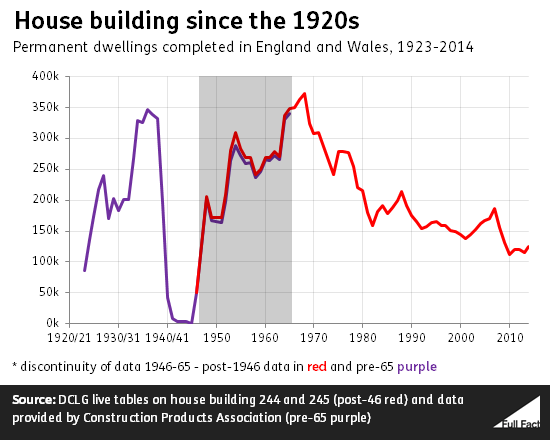
- Housebuilding is at its lowest peacetime position since the 1920s in England and Wales
- The UK still compares well internationally on overcrowding and unaffordability
British house price rises have been among the largest in the world
Surprisingly, there is no single, simple measure of house price change in the UK. The ONS says UK homes cost £265,000 on average in 2014, but takes this figure from a sample of mortgages agreed by regulated lenders. This means that homes bought without a mortgage aren't included. The Land Registry keeps a record of every sale — mortgaged or otherwise - and says that the average house price was £180,252 at the beginning of 2015. But this data only covers England and Wales, and they calculate their figures differently, so the estimates aren't fully comparable. Mortgage lenders such as Nationwide and Halifax also produce their own house price indices.
Whichever measure you use, however, it is clear that house prices have risen sharply in the UK over recent years. According to the Land Registry, the price of the average home has nearly trebled since 1995. According to the ONS, it is closer to quadrupling since 1993.
In fact a comparative house price index compiled by The Economist found that the value of British homes had risen more sharply than almost any other major country over the past half century. It reported that while US homes had risen by 650% in value since 1975 and German property prices had doubled, the UK had seen house prices shoot up by over 2,000%. Only South Africa and Spain had seen property rise in value by more over the same period among the 17 countries it looked at.
Join 74,000 newsletter subscribers who trust us to check the facts
Sign up to get weekly updates on politics, immigration, health and more.
Subscribe to weekly email newsletters from Full Fact for updates on politics, immigration, health and more. Our fact checks are free to read but not to produce, so you will also get occasional emails about fundraising and other ways you can help. You can unsubscribe at any time. For more information about how we use your data see our Privacy Policy.
Younger first-time buyers are being squeezed
A common critique of the sharp rises in house prices is that it has put home-ownership beyond the reach of younger would-be buyers.
The ONS keeps track of the age of those taking out a mortgage on their first property. At first glance, these statistics might seem to pour cold water on the idea that younger people are being priced out of the housing market. In 1990, when data was first published, the average age of a first-time buyer was 33. In 2013, it was 32.
But the average age doesn't tell the whole story. In 1990, almost a third of first-time buyers were under 25, whereas in 2013 just 14% were. At the other end of the age scale, the proportion of first-time buyers over 55 has fallen from 7.9% to 1.6% over the same period.
There's also evidence that the lack of affordability of housing may be a factor in this squeeze. According to the mortgage lender Nationwide, the house price-to-earnings ratio has almost doubled for first-time buyers in the past 30 years. In 1983, the average UK home cost for a first-time buyer (or buyers in the case of joint mortgages) was the equivalent of 2.7 times their total annual earnings. In 2015 this had risen to 5 times their income. In London the problem is particularly pronounced, as the ratio has increased from 3.7 to 9 times average incomes.
A million households waiting for social housing
Social housing is low-cost accommodation which is let by a local council or housing association to those deemed to be in particular need, at rents below those typical in the private rental market. Slightly less than one in six households in England were social renters in 2013/14, with two million finding their home through a housing association and a further 1.7 million through a local authority in 2012/13.
There are a further 1.37 million households on waiting lists for social housing in England. While that's more than it was at the turn of the millennium, it's down from a peak of over 1.8 million in 2012. However this doesn't necessarily mean that more people are being provided with homes: in 2011 the Government gave local authorities the power to restrict eligibility for social housing, most notably excluding those that did not have a connection to the local area.
Rents in the social rented sector have also been growing at a faster rate than they have for private tenants, according to the English Housing Survey. In 2008/09, the average social rent was 46% of the average private rent in England. In 2013/14, the most recent year for which there is data, this had risen to 53%.
Housebuilding is at a historic low
The number of new homes being built in the UK has been falling since the 1960s, and in England and Wales, recent years have seen the fewest new homes completed per year during peacetime since the 1920s. In 2014, 125,000 new homes were finished, less than a third of the number built during the peak years half a century ago. By comparison, the government estimates that each year between now and 2021 is likely to see the number of households in England rise by 221,000.
While internationally comparable statistics on housebuilding are hard to come by, one study done by the think tank Policy Network in January 2015 found that the UK was building fewer new homes than other comparable countries. Between 1975 and 2013, the UK built on average 3.6 homes per 1,000 people, the lowest rate of any of the seven countries the researchers looked at. The Netherlands fared best with 6 homes built per 1,000 of population.
Crisis, what crisis?
Despite the sharp rises in house prices and the steep fall in house building seen over the last few decades, the UK still fares comparatively well when it comes to overcrowding and unaffordability.
According to Eurostat — the European Union's statistical arm — 7.4% of Brits were 'overburdened' by housing costs, spending more than 40% of their incomes to keep the roof over their heads. This was below the EU average of 11.2%, and significantly below other large European nations such as Germany (16.6%), Spain (14.3%) and the Netherlands (14.4%). In Greece, almost a third of residents were said to be overburdened by housing costs in 2012.
_YB14_II.png)
More information:
- The House of Commons Library produces a regular report on the housing market, taking in prices, housebuilding and mortgage approvals.
- Besides its monthly release of the House Price Index, the ONS produces commentaries and analysis of housing data.
- Data on the rental market is published by the Department for Communities and Local Government.
- In England, the most comprehensive appraisal of the country's housing stock is the English Housing Survey, published annually.
Correction (19 April 2015)
We originally said there were 1.37 million people on a waiting list for social housing in England, as of 2014. This was incorrect and should have said 1.37 million households. The references to this have been updated. We're sorry for the error.
Update (28 April 2015)
Following feedback, we've updated the section on British house prices to reflect the latest data, and to clarify differences in calculation between the ONS and the Land Registry.