How have wages changed over the past decade?
Join 73,000 newsletter subscribers who trust us to check the facts
Sign up to get weekly updates on politics, immigration, health and more.
Subscribe to weekly email newsletters from Full Fact for updates on politics, immigration, health and more. Our fact checks are free to read but not to produce, so you will also get occasional emails about fundraising and other ways you can help. You can unsubscribe at any time. For more information about how we use your data see our Privacy Policy.
Real wages are a race between your pay packet and prices
The ‘real value’ of your wage depends on two things. First, the money in your pay packet. Second, the price of things you need to buy.
If prices rise faster than your pay packet then you won’t be able to buy as much. There are more coins in your pocket but the “real” value of your wage will have fallen.
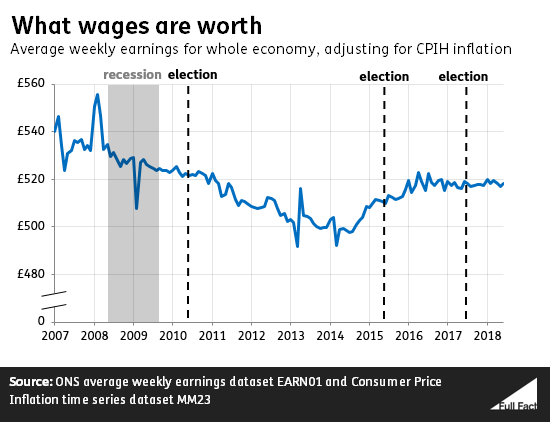
That’s what happened after the recession in 2008. Consumer prices rose faster than the average wage, so its real value fell. It continued to fall until 2014.
The average real wage is lower now than it was ten years ago
Following the recession in 2008, average wages fell almost consistently in real terms until mid-2014. From 2014 to 2016, inflation was low and wages increased, though they’re still not back to their pre-recession levels. Now, inflation has caught up again, and real wages are levelling off.
Many people are earning more
Falling average earnings don't mean that everybody's or even most people's wages are falling. The average wage is affected by who is working too. Well-paid people leaving work and less well-paid people starting work would reduce the average wage even if nobody in the country had a pay cut.
Analysis by the Office for National Statistics showed that in 2014, average earnings for full-time workers grew by only 0.1% but the average earnings of full-time workers who had been in their job for more than a year rose by 4.1%.
So although the drop in average earnings tells us something important about the economy overall, it's not the same as what's happened to everybody working in the UK.
London and the South East have seen the steepest falls in earnings
The level of wages is different depending on where you live in the UK.
Wages are highest in London, and they’ve also seen the biggest falls. The average full-time employee in London earned £655 a week in 2017; down from £700 in real-terms in 2009.
The smallest fall was seen in Northern Ireland, where in 2017 the average full-time weekly wage was £504 a week, down from £522 in real terms in 2009.
All regions still have the same broad pattern: falls after 2009 and a recovery since 2014. No region’s average full-time weekly earnings is above its 2009 level.
The public sector has seen slower growth
If you work for the public sector, such as in the NHS, state schools or the civil service, your pay growth has been restricted in recent years as a matter of policy.
Public sector pay has grown more slowly than private sector pay for the past four years – though recently it has started to catch up as the caps have started to be lifted.
But public sector pay is also less volatile: it was the private sector that suffered large falls in pay during the post-recession years. It's only now caught up to the point that both sectors' pay has changed by about the same amount since the recession.
As of June 2018, public sector pay (excluding financial services) was growing at 2.2% a year, just behind inflation (2.3%) and private sector workers at 2.4%.
There are also fewer low-paid workers in the public sector, so recent policies like the introduction of the National Living Wage haven’t had as large an effect on public sector pay.
Men, high-earners and the young have fared the worst
The Institute for Fiscal Studies (IFS) looked at employees’ pay across age, gender and earnings last year. Since 2008, the value of men’s pay on average has fallen by just over 7%, compared to a fall of under 2% for women. In Scotland, Wales, Northern Ireland and North East England, the value of women’s pay has actually increased.
Similarly, “younger workers typically fare worse during downturns”, according to the IFS. Average earnings for workers aged between 22 and 39 fell most in the years following the recession, although those in their twenties have seen their average wages rise fastest since 2014.
The recession itself affected low and high earners roughly equally, but low-paid earners have seen the fastest average wage growth since 2014: the lowest-earning 10% of workers saw their average pay rise by over 12%, compared to under 5% for middle and high earners. That’s partly reflected by growth in the minimum wage and the new National Living Wage, faster than inflation.
For more on what’s happened to wages across the UK, the IFS and the Resolution Foundation have looked at the distribution in more depth.
Self-employed income decreased between 2007 and 2016
The analysis above focuses on employees and doesn’t include how wages have changed for self-employed people – who make up 15% of people in work.
That’s because data on self-employed income isn’t as high quality, nor as timely, as data on employee incomes. The Office for National Statistics uses several data sources, but the latest is from 2016.
Data from HMRC shows what self-employed people earn from their self-employed job activities, and what they earned in total when including all their other incomes (for example second jobs and investments).
The data shows self-employed people have seen a much larger income reduction over the past decade than employees.
Self-employed incomes fell by 26% between 2007/08 and 2015/16 from an average of £21,600 to £15,900 in 2015/16 prices.
The average total income of self-employed people fell, in real terms, by 20% over the period, from £34,200 to £27,400.
There’s more to income than wages
This article looks at how wages have changed over the past decade. To understand changes to peoples’ incomes we need to consider tax and benefit changes as well.
Working households’ average income after taxes and benefits has fallen slightly in real terms, from £35,100 in 2008/09 to £34,500 in 2016/17. That’s calculated by adding income to cash benefits and then subtracting direct tax (e.g. income and council tax) and indirect taxes (e.g. VAT) for households where at least one person earns income from employment or self-employment.
Update 15 November 2018
We updated the section on household income after taxes and benefits with new data from the Office for National Statistics.