Taxes reduce the disposable income of young people, as they do for most age groups.
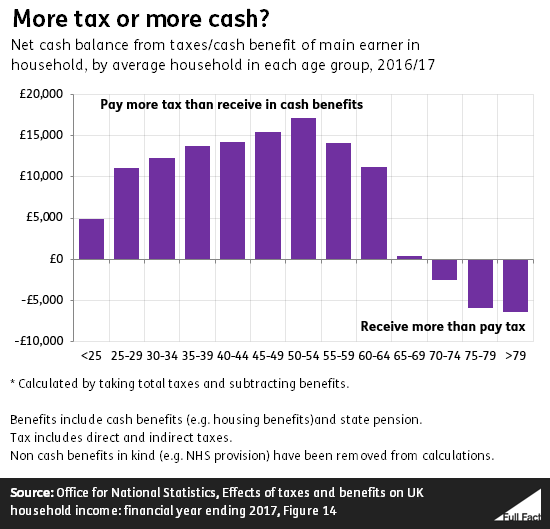
Figures from the Office for National Statistics (ONS) show that households where the main earner is over 70 receive more cash benefits than they pay in tax (primarily through pensions), while those households where the main earner is under 65 pay more in tax than they receive in cash benefits.
This can’t be looked at in isolation. Other government policies will have increased or decreased the cost of living for young people, without directly or indirectly taxing them.
In this piece, we’re focusing on the direct effects of the tax system. Taxes obviously have indirect benefits, like NHS or education services that taxes are spent on. There are ways to include estimates of these kinds of benefits, but here we’re just going to put the cash balance under the spotlight.
How much tax do young people pay?
The average household in which the main earner is under the age of 25 pays almost £9,500 in tax annually, according to ONS figures for 2016/17. This includes direct taxes (like income tax), indirect taxes (like VAT on goods.) They receive about £4,500 in cash benefits meaning the average household is taxed about £3,750 more than they get back in cash benefits.
A word of caution: the ‘average household’ is only a very broad measure, it won’t tell you about how that varies across the population, or show anyone’s individual experience.
In 2016/17 the net contribution of the average household where the main earner is under 25 is equivalent to 19% of their household income. That’s lower than any other age group. However, while they made the lowest net contribution of any household of that age group under 65, they also have the lowest income, averaging around £21,000 post-tax and post-cash benefits.
Meanwhile, households where the main earner is aged between 50 and 54 contribute the most—the equivalent of 39% of their household income in taxes. But they earn more than under 25s, because they have a higher income to start with.
Not all of the taxes people pay comes off their income. 50-54 year-olds usually have more wealth built up than younger people and as they spend this they’re likely to pay more towards taxes like VAT.
Households where the main earner is 25-29 have the highest income post-tax and benefits. They earn on average around £40,000 pre tax and make a net contribution of around £11,000, leaving them with around £29,000.
Most government policies, not just taxes, affect spending power
Taxes and benefits are the most direct way in which the government alters the spending power of young people. But many other policies also have an impact.
For example, the Help to Buy programme launched in 2013 tried to help first time buyers by offering favourable loans, mortgages and ISAs, but the IMF warned that the scheme could just inflate prices making housing more unaffordable.
On the other hand, price regulation in the energy industry for certain consumers has arguably reduced the cost of living for those consumers, without using taxes or benefits.