If politicians talk about the rich, always ask who they mean
We often hear discussion of “the rich”, “the best-off” or “those with the broadest shoulders”. However, it is rarely clear from such statements exactly who is being referred to.
There is an important distinction between people with high wealth and people with high income. High-income people are those who receive a large flow of money over a period of time (from things like salaries, bonuses, or profits for the self-employed). High-wealth people are those who have built up a valuable stock of assets at a point in time (typically in property, pension pots or other financial assets).
While there are many people with both high wealth and high incomes, the overlap is far from perfect. There are wealthy individuals with low incomes, such as older people who own a valuable house but have little income; and there are high-income people who have accumulated little wealth, such as young renters with high-paying jobs.
How much wealth or income do you need to qualify as being rich? While the answer is ultimately subjective—and the available data is limited (particularly for wealth)—some figures help provide context.
Join 74,000 newsletter subscribers who trust us to check the facts
Sign up to get weekly updates on politics, immigration, health and more.
Subscribe to weekly email newsletters from Full Fact for updates on politics, immigration, health and more. Our fact checks are free to read but not to produce, so you will also get occasional emails about fundraising and other ways you can help. You can unsubscribe at any time. For more information about how we use your data see our Privacy Policy.
Wealth
Take wealth to begin with. Unofficial data shows that there are some extremely wealthy people living in the UK. For example, every year the Sunday Times publish a ‘Rich List’ of 1,000 individuals and families, each with estimated wealth of more than £100 million. These are clearly extremely wealthy people, but they make up less than 0.002% of the UK adult population. Most people’s idea of “the richest” is probably broader than that.
The Office for National Statistics carries out a household survey that gives a broader view of the distribution of wealth, although it doesn’t do a good job at covering the very wealthiest, who tend not to respond to household surveys.
As the graph below shows, to be in the top 1% of households in Great Britain (around 260,000 households) means you have more than £2.9 million in total wealth, after accounting for any money you owe. This includes houses, private pension pots, money in bank accounts and other financial assets.
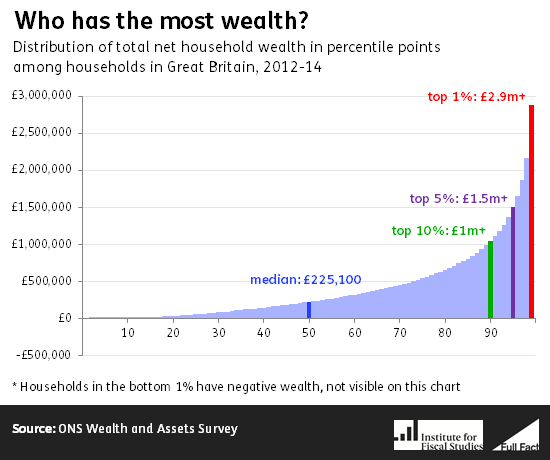
Much but not all of the variation in wealth between households is a result of being at different stages in their lives. People tend to save while working and then draw on their assets to finance spending in retirement. So even if everyone had the same income and spent the same amount at each stage in life, these “lifecycle effects” mean that those about to retire would still be wealthier than those who’d just started working or had been retired for a long time.
So it’s not surprising that ONS figures show that 25% of individuals aged 55-64 live in a household with £1 million or more, placing them in the top 10% of households, compared to just 4% of those aged 25-34.
However, there is also significant inequality in wealth between individuals of the same age. Another 23% of those aged 55-64 live in a household with wealth of less than £200,000. In addition, there is good evidence that younger generations today may struggle to ever reach the wealth levels currently held by older households.
Income
How much income do those at the top have? There are different ways of answering this question depending on whether we mean the personal income of individuals (which is what the income tax system deals with) or the total income of their household; whether we measure incomes before or after tax; and which sources of income are included.
HMRC data tell us about individual incomes for anyone who pays income tax. This excludes the 40% of adults who do not pay income tax at all because their taxable incomes are too low; and sources of income not subject to income tax, like some state benefits (but it includes state pensions).
To be in the top 1% of income taxpayers in 2014-15 (excluding the 40% who don’t pay income tax) required pre-tax income of at least £162,000 per year.
To be in the top 5% of income taxpayers you need a pre-tax income of about £72,000 per year. This is £50,000 more per year than the median income taxpayer.
But there’s an even bigger gap between that top 5% and the top 1% of taxpayers— you would need to earn £90,000 more to hit that 99th percentile. So someone earning £72,000 a year is a lot closer to the median taxpayer (about 13.7 million people below them in the income distribution) than to the top 1% (about 1.2 million people above them).

Even within the top 1% of income taxpayers, there is substantial inequality. HMRC estimate that almost 50,000 income taxpayers (0.1% of UK adults) had more than £500,000 in pre-tax income in 2014-15, amounting to £55.5 billion between them. 39% of this—£21.8 billion—went to just 5,000 individuals.
These HMRC figures do not account for the fact that people live in households of varying sizes with varying needs; or that some individuals will be the only source of income in their household, while others will be one of two or more; or that some households will have sources of non-taxable income like certain state benefits.
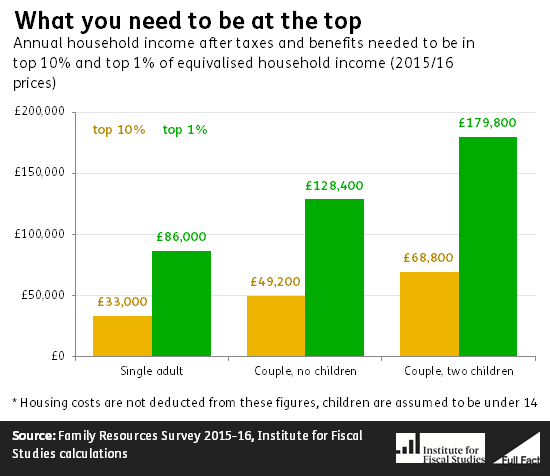
To get a better sense of who is the best-off in terms of living standards, the Department for Work and Pensions (DWP) publish a statistical income series based on an annual survey of more than 20,000 households in the UK. This measures each individual’s total household income from all sources after direct tax.
This data is then adjusted to take into account the different income needs of households, based on the number of adults and children who live in that household.
The graph below shows the income after taxes and benefits needed to enter the top 10% and 1% on this basis for individuals in three different types of household in 2015-16.
A final caveat to both HMRC and DWP’s income figures is that they capture income only at one point in time. Because income, like wealth, exhibits lifecycle effects, and can be volatile from year-to-year, a much higher proportion of people will themselves have, or live in a household with, high incomes at some point during their lives than at a snapshot in time.
Correction 11 May 2017
We corrected a small error in the sentence that reads “These are clearly extremely wealthy people, but they make up less than 0.00002% of the UK adult population”. This should instead be “These are clearly extremely wealthy people, but they make up less than 0.002% of the UK adult population”. 0.00002 is the proportion, not the percentage, of the UK adult population that they make up.