What was claimed
Government debt has doubled under the Conservatives.
Our verdict
Not correct. Public sector net debt, adjusted for inflation, rose by 53% between 2009/10 and 2016/17.
What was claimed
Government debt has doubled under the Conservatives.
Our verdict
Not correct. Public sector net debt, adjusted for inflation, rose by 53% between 2009/10 and 2016/17.
What was claimed
The national debt almost tripled under the last Labour government.
Our verdict
Correct in cash terms, but after adjusting for inflation it’s more like doubled than tripled. Public sector net debt, adjusted for inflation, rose by 125% between 1996/97 and 2009/10 – mostly after the recession that began in 2008.
Labour was in power between 1997 and 2010, followed by the Conservatives (leading a coalition and then alone) from 2010 to 2017. The amount of money the government owes has mostly risen over those two decades, under administrations of both hues. In particular, the financial crisis and ensuing recession led to a considerable increase in debt from about 2008 onward.
We don’t examine here how much debt, if any, particular governments’ policies have caused. The facts on debt here shouldn’t be taken as proving that one party is more profligate than the other.
Public sector net debt, the measure we’re using here, is what the government owes to private institutions. It doesn’t include money owed between different branches of the government—in other words, it doesn’t count what the government owes itself—or the debts of banks owned by the government.
In terms of raw cash, here’s how that debt looks:
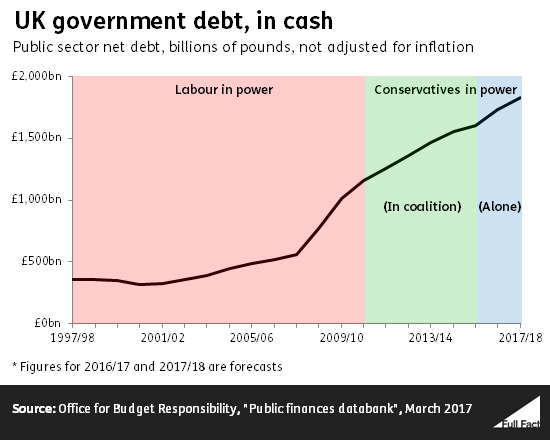
That’s a cash terms rise of 191% over 13 years, which compares to a 71% rise over seven years with Conservative Chancellors between 2009/10 and 2016/17.
However, the natural rise in prices means that £347 billion was worth more in 1996 than it looks like now. Taking inflation into account, the trend looks very similar:
Join 74,000 newsletter subscribers who trust us to check the facts
Sign up to get weekly updates on politics, immigration, health and more.
Subscribe to weekly email newsletters from Full Fact for updates on politics, immigration, health and more. Our fact checks are free to read but not to produce, so you will also get occasional emails about fundraising and other ways you can help. You can unsubscribe at any time. For more information about how we use your data see our Privacy Policy.
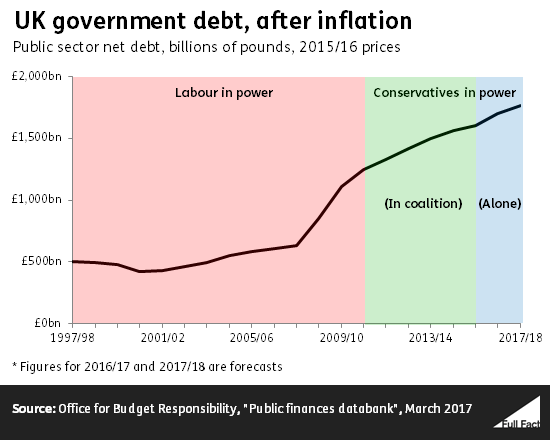
The equivalent figure for the Conservatives up to 2016/17 is 53%. That means that UKIP and other critics of the government are wrong to claim that “the Tories have doubled the national debt”. That would only be true, in cash terms or in real terms, if you started from 2008/09, whereas the first year for which the Conservatives (and their Liberal Democrat coalition partners) can be said to be responsible for the debt is 2010/11.
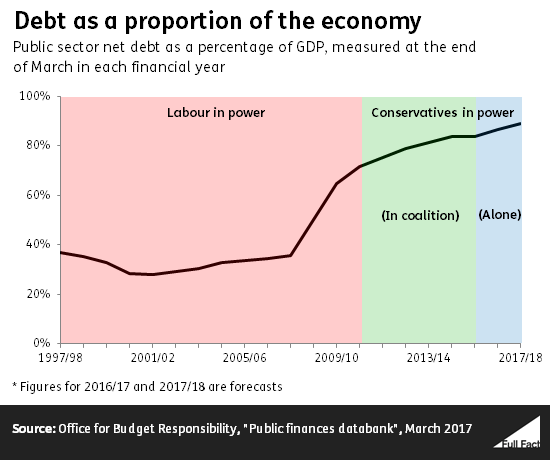
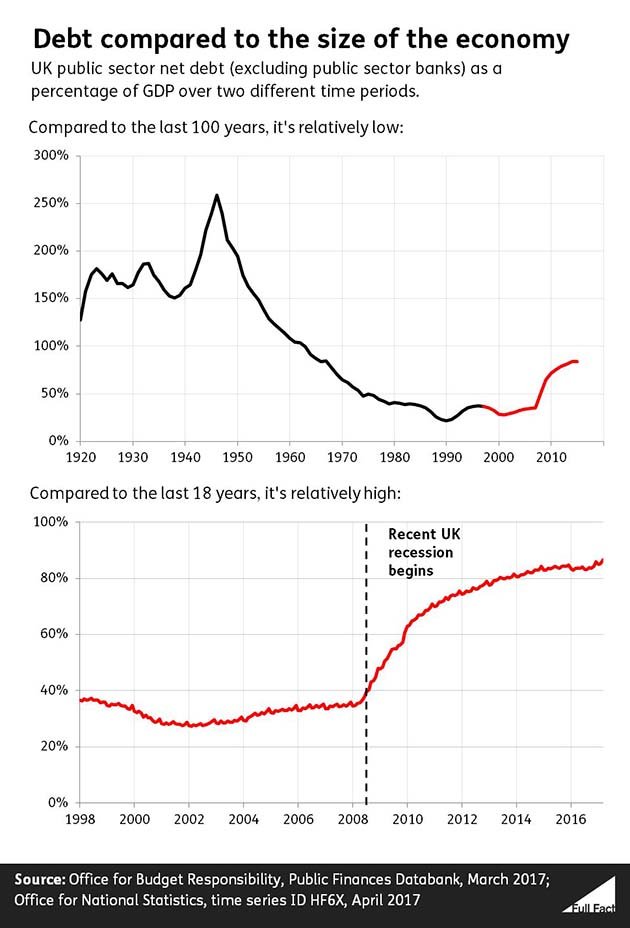
As we go into at greater length in our explainer on “how much the government owes”, it’s common to look at government debt compared to the size of the national economy. The bigger a country’s GDP, the easier it is for the country to support high government debt.
Public sector net debt as a proportion of GDP was down under Labour for most of its term. But it then jumped from 36% of GDP in 2007/08 to 65% in 2009/10.
Full Fact fights for good, reliable information in the media, online, and in politics.
Fact checking claims made by politicians, public figures and viral online content can give you the full picture backed by the evidence.
Subscribe to weekly email newsletters from Full Fact for updates on politics, immigration, health and more. Our fact checks are free to read but not to produce, so you will also get occasional emails about fundraising and other ways you can help. You can unsubscribe at any time. For more information about how we use your data see our Privacy Policy.