The Labour Party is selling election leaflets to its supporters that include an inaccurate claim about the cost of living crisis. It is also running a number of adverts on Facebook making the same claim.
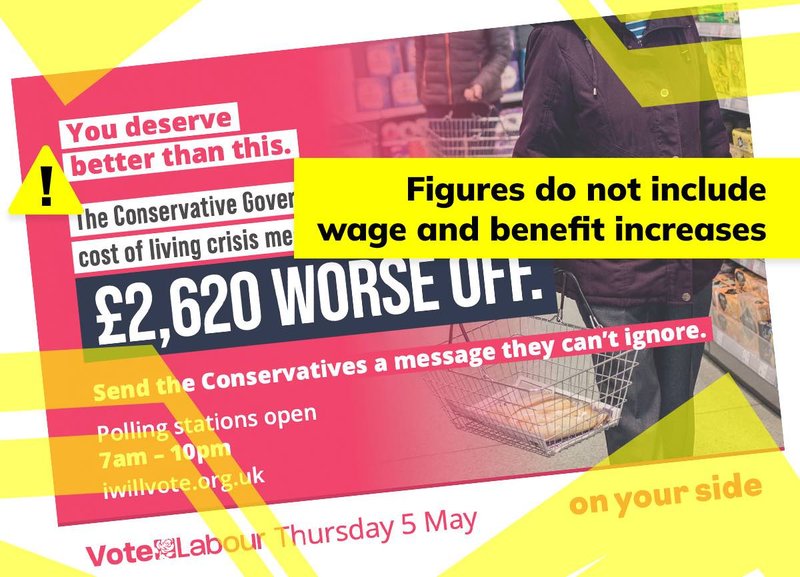
One of the leaflets, which at the time of writing are listed as “in stock” by the Labour Party’s online shop at a cost of £15 per 500 units, says: “The Conservative Government’s cost of living crisis means families are £2,620 worse off.” (The party sells leaflets to its supporters so they can distribute them to voters ahead of the upcoming local elections on 5 May.)
One of the Facebook adverts says: “Under the Conservatives families are £2,620 worse off”.
This is not correct, as Full Fact has explained in detail before.
Although the average household is expected to experience a large fall in its living standards in the current financial year, independent estimates suggest the fall will be significantly less than £2,620.
Labour reached its figure of £2,620 by adding together several estimates for different cost rises, some of which are unexplained or unreliable. Crucially, it also did not offset these costs against rises in benefits or wages.
We have asked Labour how many leaflets have been sold, or distributed to voters, but have not received a response at the time of publication.
Where did this number come from?
After our first fact check was published earlier this month, Labour confirmed that the total was reached by adding together estimates for rising costs from tax (£1,060), energy prices (£690), petrol (£300), food (£275) and mortgages (£295). An obvious problem here is that these five items don’t cover all changes to income and expenditure that a typical household might expect to face. In particular, Labour’s total doesn’t appear to include any changes to wages or benefits at all—and the cash value of some wages and benefits is rising, including wages of people employed by the government.
Labour has not shared the full details of how its estimates were calculated, but some also appear to be unreliable, based on details reported when they were first announced.
For example, the Guardian reported that Labour calculated the mortgage figure based on “the impact of interest rate rises on the cost of servicing a £100,000, 20-year variable rate mortgage”.
But only about 30% of households have a mortgage, at least in England in 2019/20, according to the latest English Housing Survey. What is more, about three quarters of those with mortgages have a fixed-rate mortgage, which means their payments won’t immediately rise in response to interest rate rises, unless their fixed-rate period runs out this year.
Labour’s estimated tax rise is also not reliable if it is based, as the Guardian reported, on a rise in the estimated overall tax burden when shared between the total number of households. This is because some taxes, such as business taxes, are not paid by households.
By how much will living standards fall?
Forecasting changes to living standards is always tricky—particularly at the moment when inflation forecasts are changing rapidly. Estimates will also vary depending on the methodology being used.
That said, independent estimates which factor in both rising costs and increases in benefits and wages put the likely impact on the average household significantly lower than Labour’s figure of £2,620. The Office for Budget Responsibility has specifically estimated the change in living standards over the next year. It said in March: “Real household disposable incomes per person fall by 2.2 per cent in 2022-23, the largest fall in a single financial year since ONS records began in 1956-57.”
Estimating the size of this impact on the disposable income of the average household depends on which definition of the “average household” you use.
You could apply the 2.2% fall to the latest available data on the disposable income of the “average household”. Using the Office for National Statistics’ (ONS) figure for the mean non-equivalised household income produces a figure of about £1,000.
(The ONS defines equivalisation as “a standard methodology that adjusts household income to account for the different financial resource requirements of different household types”.) Another simple way to estimate a figure is to roughly calculate the size of a 2.2% fall in the whole country’s disposable household income in 2021, then divide this by the 28.1 million households in the UK. This gives a figure of about £1,200.
Other independent researchers have also attempted to estimate the fall in the standard of living over the next year, using different methodologies. For example, talking about non-pensioner households specifically, the Resolution Foundation estimates there may be a 4% drop in median equivalised household disposable income in 2022/23, which it says would equate to a fall of about £1,100.
In an earlier research document, published in February before the invasion of Ukraine and the Chancellor’s Spring Statement, the National Institute of Economic and Social Research estimated that each household would be “about £1,000 per annum worse off”, although this did not include all costs and for example excluded changes in food and fuel prices.
All of the estimates above come with different caveats. But while there are various arguments for different methodologies, and a range of estimates as a result, none of the figures we’ve seen which factor in increases in benefits and wages are close to Labour’s estimate of £2,620.
Labour has not corrected this
We have asked Labour to correct the record on these claims, but at the time of writing it has not done so. When we first looked at this figure, we asked Labour four times for details of how the figure of £2,620 was calculated, but it did not respond. After our original check was published, it did then share some details with us, but these did not substantiate its claim or address the criticism of it, and we have not had a response to further questions.
Since our original fact check was published, the Shadow Education Secretary Bridget Phillipson has repeated the claim on Facebook.
At the time of writing, Labour has published at least four active Facebook adverts that make the claim, all of which are listed as having launched after we had told the party that it wasn’t correct.
We asked the Labour Party if it plans to withdraw the leaflets and adverts. We have also asked Ms Phillipson if she agrees that the claim is not correct. Neither had replied at the time of publication.