Measuring social mobility: how does the UK perform?
- Both academics and government measure 'social mobility' in a variety of ways.
- Academics can't agree on whether social mobility has declined or remained the same over the last fifty years and whether Britain's mobility is average or poor compared to other developing countries.
- Government measurements often compare the performance of children eligible for free school meals with their peers - a measure limited in how much it truly indicates a child's 'disadvantage'.
Over the last few years Britain has not fared well—at least according to media report such as: "'disturbing reversal in social mobility over last thirty years" and "Britain has worst social mobility in the Western world".
And in 2011 the Coalition government published its strategy for social mobility, a policy which in 2014 Deputy Prime Minister Nick Clegg described as "one of my biggest priorities in government over the last four years".
But what do we actually mean by 'social mobility'? In social science terms, social mobility refers to whether you can easily move up and down income levels, occupational structures and/or levels of education or other social structures, how this compares to others' chances, and how much your chances are determined by the equivalent position of your parents. In more general terms, social mobility is discussed as how well children seen as disadvantaged do at school and in their later lives compared to those seen to be advantaged.
Four ways to define social mobility
Join 74,000 newsletter subscribers who trust us to check the facts
Sign up to get weekly updates on politics, immigration, health and more.
Subscribe to weekly email newsletters from Full Fact for updates on politics, immigration, health and more. Our fact checks are free to read but not to produce, so you will also get occasional emails about fundraising and other ways you can help. You can unsubscribe at any time. For more information about how we use your data see our Privacy Policy.
- Inter-generational social mobility - the extent to which a person's 'social positioning' is determined by that of their parents
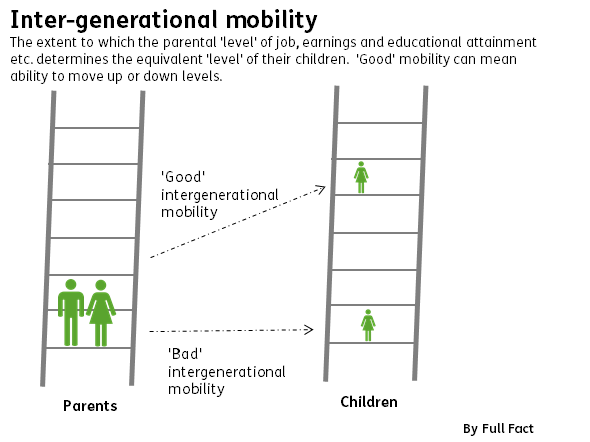
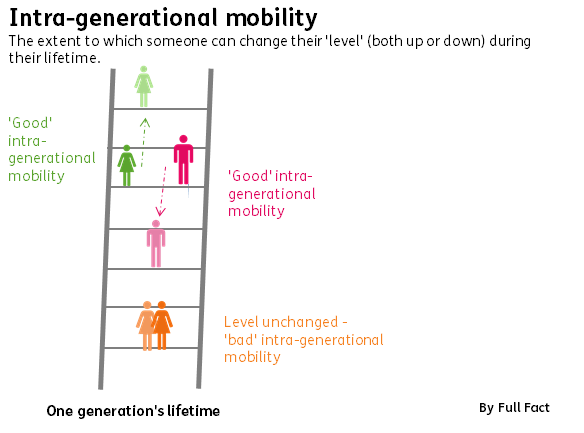
- Intra-generational social mobility - the extent to which a person's 'social positioning' can change within their lifetime
- Absolute social mobility - the extent to which a person can move between different 'social positions'
- Relative social mobility - the extent to which a person in one 'social position' has the same opportunity as someone in another 'social position' to move up (or down) the 'social ladder'.
To measure these you also have to decide which element or combination of factors to look at to determine a 'social position' - like income, educational attainment, or jobs.
Conflicting evidence on whether inter-generational mobility has 'declined'
The claim that social mobility has declined in Britain dates back to an academic study in 2004 with the Sutton Trust - updated by its authors in 2007. They looked at how likely a child's position in the income scale is to reflect their parent's position. While the chances were the same for children born in 2000 compared to children born in 1970, their earlier study found the likelihood of children having the same position as their parents was weaker for children born in 1958 - leading to the assertion that social mobility had declined between 1958 and 1970. This perceived decline was later described by the authors as temporary and the result of the "particular circumstances of the time".
But their approach has been recently criticised by Dr John Goldthorpe at Oxford University who said the data available is not of a high quality and who warned against basing the conclusion on one report. He argued that there has been no decline in either absolute or relative mobility since the inter-war years - apart from rising rates of upward absolute mobility in the middle decades of the last century. For men this has now levelled out.
Impact of parental background similar to other countries
It has previously been claimed that Britain has the worst social mobility in the developed world, based on an OECD report. The OECD report concluded that growing up in a better-educated family in the UK made it particularly likely that you would earn more than your peers.
But Dr John Jerrim at the Institute of Education has raised concerns about this approach too, saying that different measurements of income mobility across different countries means the data just isn't of high enough quality to make comparisons. His report, looking instead at the impact of parental education on the income that individuals achieve in later life, found little evidence that the associations between the two were substantially stronger in Britain than in most other countries (aside from Scandinavia and a few central European countries).
Broader social mobility indicators
The government has started to publish a broader set of social mobility indicators focusing on inter-generational social mobility and relative social mobility. They focus on parental occupation and income (like the global academic studies), but also consider environmental effects such as the type of school or the deprivation level of the school area - and what impact these have on educational achievement and employment. They demonstrate just how different the picture over time can be depending on which measure you look at - although none suggest high social mobility.
A common feature in the indicators is the use of eligibility for Free School Meals (FSM) to compare disadvantaged children to their peers. But there's been criticism of using FSM as a measure of disadvantage, since it's solely related to parental income (rather than say, parental education). FSM is a statutory benefit available to school aged children from families who earn a maximum gross annual income of £16,190 and who receive other qualifying benefits - so it also means that children with parental income just above this are not included in the measure.
There is a clear gap between these children and others - but in some cases its decreasing. Looking at the numbers of children aged 11 achieving level 4 in both English and Maths at the end of KS2, the gap between the proportion of those eligible for free school meals achieving this level and the proportion among all other pupils has decreased from 25% in 2005-06 to 16.8% in 2011-12.
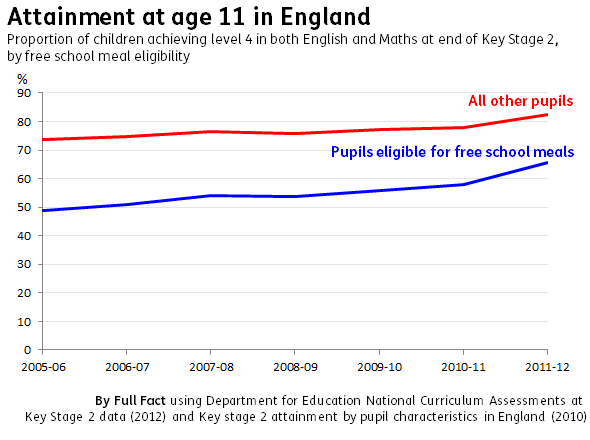
For 2011/12 and 2012/13 the government has published a separate set of scores for this indicator, which look at reading and writing scores instead of a more general English level. For the purposes of comparability back to 2005-06, we've used just English and Maths scores for 2011/12 and not included the 2012/13 scores.
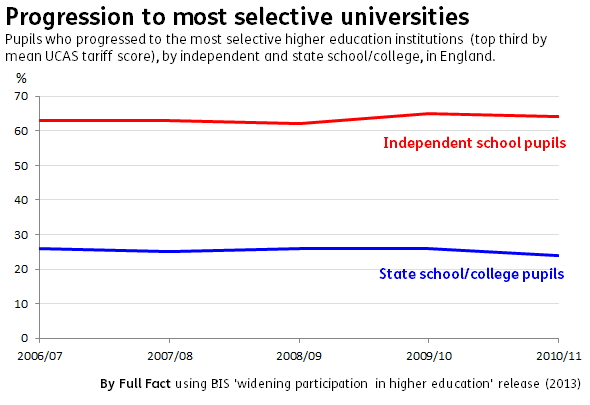
But, taking another measure, this time the progression rate to the most selective universities by state and independent school pupils, the gap here has increased - from 37% in 2006/07 to 40% in 2010/11. 'Most selective' is defined here as the top third of universities when ranked by the mean UCAS score of their entrants (based on their top three A level grades).
So there is no one way to measure disadvantage or social mobility - and when looking at one it's important to look at it within the context of others.