Is the 'North-South divide' shrinking or growing deeper?
A political battle for the North was waged between the Coalition and Labour earlier this week, with each side claiming that it had done more to promote economic growth north of the Watford Gap than the other.
Speaking in Manchester, Chancellor George Osborne promised a "Northern powerhouse" that would combine the clout of the major post-industrial cities in the region, while Labour hit back by claiming that Mr Osborne had overseen a widening of gap in economic performance between the regions since 2010.
"Which part of England has the fastest-growing economic activity right now? The North-East.
"Where are people joining the labour market at the fastest rate? The North-West and North-East.
George Osborne, 23 June 2014
To bolster his case, George Osborne lists three measures which he claims show that the North is leading the UK in terms of jobs and growth. We asked the Treasury to provide the evidence for his claims, but it has yet to do so.
However as we've seen before, the most common way to measure regional economic activity is by looking at Gross Value Added (GVA): the amount of output generated by a region given the resources available to it.
It's difficult from the published data to get a sense of what is going on "right now". The latest figures were published in December 2013, and show growth for either the 2011 or 2012 calendar years, depending upon whether you look at the 'income approach' or the 'production approach'.
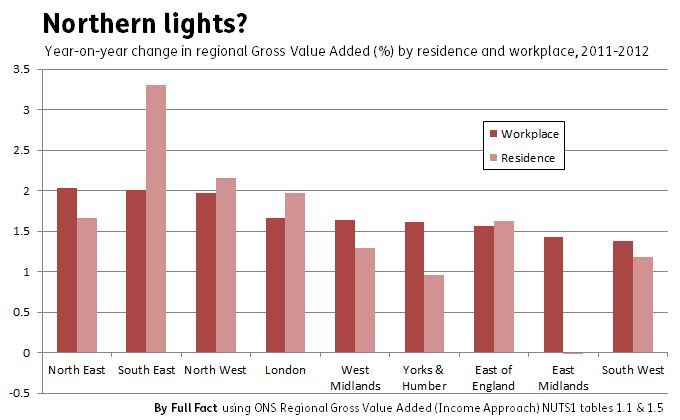
One measure contained within this data does show the North East to have been the fastest growing region in 2012: the resident-based income approach. In 2012, the earnings generated by people living in the North East grew by 2.03%, fractionally more than the the 2% growth seen in the South East over this period.
Interestingly though, the same isn't true if we take the workplace-based approach, dividing up earnings based upon the region in which a person works, rather than lives. This shows that economic activity in the North East grew 1.67% in 2012, placing it behind the South East (3.31%), the North West (2.15%) and London (1.97%). The difference between the two measures might suggest that those living in the North East are actually benefiting from an improved outlook farther afield.
Economic activity in the North is up, but not necessarily employment
When it comes to the labour market, the data is a bit more up-to-date.
This month's labour market statistics from the ONS showed that the proportion of working-age adults that are economically active grew fastest in the North East (1.7%) and North West (0.7%) in the last quarter of 2014.
However 'economically active' people can be either employed or looking for work (unemployed), and it's worth pointing out that the increase in the proportion considering themselves to be economically active in this period in the North East and North West isn't accompanied by a similar growth in the proportion in work.
In fact, the North East was the only region to see a growth in the unemployment rate in this period, while London, the South East and the Midlands all outperformed the North West on this measure too.
Looking at one quarter in isolation might also give an imperfect picture of the longer-term trends, and while the North East still saw the largest jump in the economic activity rate in the year to April 2014, the North West was among the worst performing regions over this time scale for the same thing.
"Regional growth divides have widened markedly since 2010." Ed Balls, 23 June 2014
Labour's Shadow Chancellor responded to Mr Osborne's speech by claiming that the gap between the regions in terms of economic performance had actually widened under his watch.
We contacted Mr Balls's team who directed us towards research published by the Smith Institute think tank last month.
This compared the growth in GVA per head in each of the English regions in the periods 2000-2010 and 2010-2012, and found that while the North East, North West and Yorkshire and Humber all saw growth in excess of that in London and the South East in the first decade of the century, all but the North East have fallen behind between 2010 and 2012.
While Mr Balls' claim is accurate by this measure, we might want to be cautious about reading too much into the comparison, as growth over two years is likely to be much more volatile than it is over the course of a decade.
If we instead compare the two years of 2010-2012 with the two year period before it - 2008-2010 - we can see similarly large divides in the figures. Between 2008 and 2010 the North East and Yorkshire and the Humber were the third- and second-worst performing regions, with GVA shrinking by 0.7% and 0.9% respectively. By comparison the top performing region in England - the South West - increased its GVA by 2.9%.
It's also worth bearing in mind that while both the Chancellor and his Labour shadow focus on changes in GVA that may show the Northern regions catching up with the south, in absolute terms the divide remains large. On a per head basis, London accounts for double the GVA of either the North West, North East or Yorkshire and the Humber.