Is this the first parliament in 'living memory' to see a fall in earnings?
"This is now set to be the first time in living memory when people are worse off at the end of the parliament than they were at the beginning." Ed Balls MP writing in the Guardian, 15 April 2014
With the ONS this morning confirming that average total pay is, for the first time in over five years, no longer falling in real terms, living standards have again shot up the political agenda. Yesterday the Shadow Chancellor argued that despite the improved outlook, the UK is facing a continuing "cost of living crisis".
Labour has told us that the source of the claim is an analysis published on the TUC's touchstone blog. Using the same methods and the same or similar data we were able to reproduce the result.
The analysis involved comparing the average earnings in the UK at the beginning of a parliament to the average earnings at the end of it. This was adjusted for the change in prices over the same period to give us a figure for the percentage growth in 'real earnings'.
The figures for 1929 to 2005 come from the Bank of England's 'Three Centuries of Data' release. The release contains data up to 2009, so for the 2005 to 2010 parliament the inflation and earnings figures come from the ONS. For the current parliament all figures, including estimates for 2015, come from the Office for Budget Responsibility.
Join 73,000 newsletter subscribers who trust us to check the facts
Sign up to get weekly updates on politics, immigration, health and more.
Subscribe to weekly email newsletters from Full Fact for updates on politics, immigration, health and more. Our fact checks are free to read but not to produce, so you will also get occasional emails about fundraising and other ways you can help. You can unsubscribe at any time. For more information about how we use your data see our Privacy Policy.
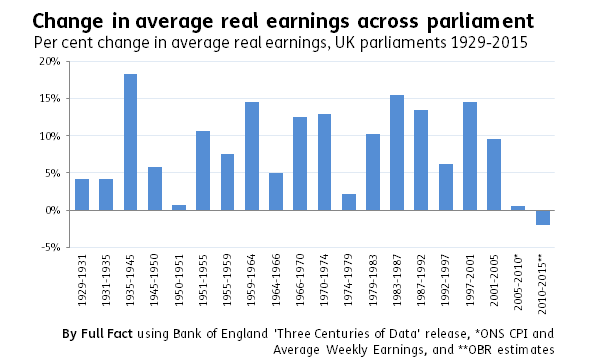
The graph gives the change in average earnings adjusted for inflation - or 'real earnings' - for periods roughly corresponding to those of different parliaments. These periods are different lengths, which will affect the extent of the change in earnings: all things being equal we would expect there to be a greater change in ten years than in one.
For earnings, it uses the mean average rather than the median average. The measure of inflation used is the Consumer Price Index (CPI), an official measure of inflation.
As the original analysis noted, the periods covered don't correspond to the exact dates of parliamentary elections. This is because the Bank of England data gives the average levels of earnings and inflation for each calendar year. So it doesn't reflect the real earnings on the days a given parliament started and ended. It also means we can't measure the change over the parliament of February to October 1974.
Given the span of time and the different data series used to construct this analysis, there might also be some comparability issues. The Bank of England data uses a now discontinued ONS series to track average wages. We got in touch with the ONS to ask how it measures up against the newer data on the same topic, and they directed us towards their own efforts to produce a model for wage growth as it is currently measured that stretches back farther than 2000.
While the ONS stresses that "it is not possible to provide assurance that there is no structural break in the long term time series due to the different methods employed in the series pre- and post- January 2000," the modeled data it provides does show slight differences to the series published by the Bank of England.
So while the data used by the TUC to conclude that the current parliament - on current projections - is set to be the first since 1929 in which real wages have fallen might be the best that we have, there are nevertheless weaknesses to it that we need to bear in mind when interpreting the results.