Both politicians are talking about the relative measure of poverty and are largely correct, although Damian Green is slightly underestimating the current rate.
Relative poverty compares households’ income to the national average. Anyone who falls below 60% of the median income is defined as in poverty.
An estimated 1.9 million pensioners were in poverty on this measure in 2015/16, out of a total 12 million across the UK. That’s a rate of 16%, and includes the costs of housing, which is the measure preferred by the government and analysts.
That also compares to a rate of 22% for the population as a whole.
You could instead look at absolute poverty, which compares people to a fixed standard of living, adjusted for inflation over time. It puts pensioner poverty slightly lower at 1.6 million and 14%, still including housing costs. Again, that’s lower than the equivalent overall poverty rate of 20%.
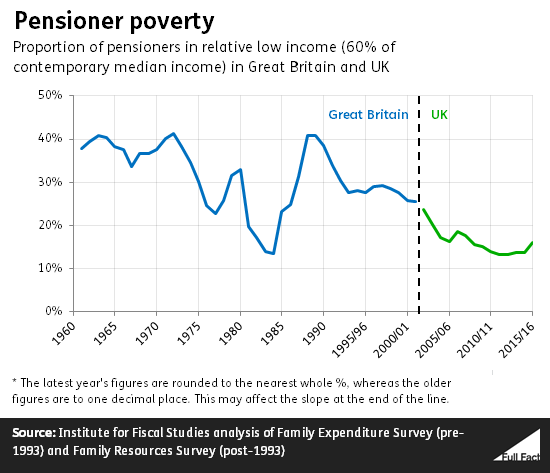
Over the long term, pensioner poverty has fallen. Relative pensioner poverty—the preferred measure for long-term trends—hit 40% at various points in the 1960s, 70s and 80s, according to analysis of official estimates from the Institute for Fiscal Studies.
Since then, it’s been falling almost constantly year on year. The latest estimate puts it at 16%. Damian Green might have been referring to last year’s estimate of 14% when he spoke on the programme.
Back in the 1990s, the absolute and relative poverty rates for pensioners were higher than the average for all households working age households without children; now the opposite is the case, according to the IFS.
Why those huge shifts in the 1980s? Pensioner poverty tends to increase in times of high economic growth, according to past research. That’s because the incomes of people in work can rise a lot faster than prices during these periods, while pensions tended in the past to track prices more closely. That means that, on the relative measure, pensioner poverty can go up simply by virtue of everyone else pulling ahead.
Work and benefits have been drivers of the recent fall
Damian Green mentioned on the programme that the ‘triple lock’ on pensions has been a key driver of falls in pensioner poverty.
The government has actually said as recently as last year that it can’t draw a direct link between the triple lock and pensioner poverty, but that it expected it had an impact.
It’s certainly true that a big part of the general trend is down to pensioner benefits faring better than benefits for working-age people over the last decade, so the triple lock is likely to play a part. The average income from pensioner benefits was down 2.5% in real terms from 2009/10 to 2014/15, compared to a 10.3% fall for working-age families, for example.
Pensioners are also increasingly in work, which is often a way out of poverty. 10% of people over the page of 65 are in work, according to the latest figures from the start of 2017. That was about 7% a decade ago and about 5% back in 1997.