Taxing the rich: what are the facts?
The Liberal Democrat conference which began over the weekend has the theme "fairer tax in tough times." By highlighting "tough new taxes on the very rich" in his opening address, party leader Nick Clegg ensured the issue was under the spotlight.
But just what does he mean by the 'very rich'? On this morning's Today programme, interviewer Sarah Montague put it to Mr Clegg that a crackdown on wealth could hit as many as three million people, or anyone earning over £50,000.
Sarah Montague: "The Daily Mail has done its sums and put that 10% [of wealthiest Britons] at around three million [people], and that means anyone earning over £50,000."
Nick Clegg: "Not for the first time, and dare I say it not for the last time, I wouldn't rely on the Daily Mail for a faithful rendition of what Liberal Democrats believe."
BBC Today Programme, 24 September 2012
The idea has also met with some early resistance among some of Mr Clegg's coalition partners. Conservative backbencher John Redwood used his blog over the weekend to argue that the way to increase the amounts paid by high-earners was actually to lower income taxes for the rich. He wrote:
"The top 1% of income earners in the UK pay 28% of the total income tax take. As they earn 13% of all the income, that means they pay twice as big a share of the tax as their share of the income."
So what are the facts about taxing the rich?
Join 74,000 newsletter subscribers who trust us to check the facts
Sign up to get weekly updates on politics, immigration, health and more.
Subscribe to weekly email newsletters from Full Fact for updates on politics, immigration, health and more. Our fact checks are free to read but not to produce, so you will also get occasional emails about fundraising and other ways you can help. You can unsubscribe at any time. For more information about how we use your data see our Privacy Policy.
Who will be hit by the proposals?
Speaking on the Andrew Marr show on Sunday, Nick Clegg focussed on "ensur[ing] that the top 10% pay more." On this basis, the Daily Mail estimated that three million taxpayers would be affected.
According to HM Revenues and Customs (HMRC), there are thought to be 29.7 million taxpayers in the 2012-13 financial year. By definition, 10% of this figure is just shy of three million.
When it comes to Income Tax, HMRC has broken down the sums paid into income deciles, and from this we can see that the top 10% of Income Tax payers is expected to encompass anyone earning over £50,500 - the figure used by the Daily Mail.
We can only say that this is 'expected', as the most recent data - which is taken from the Survey of Personal Incomes - is from the 2009-10 financial year, and estimates after that point are based on projections rather than the survey's findings.
How much tax do the rich currently pay?
The figures referred to by John Redwood can be found in the same HMRC document.
Unlike Mr Clegg, Mr Redwood focuses on the top 1% of Income Tax payers, and seems to be referring to the 2009-10 survey data rather than the latest projections.
In 2009-10, the top 1% of Income Tax payers were responsible for 13.9% of declared income before tax. Conversely, the same group paid some 26.5% of the money taken by HMRC in Income Tax. These figures are very close to those cited by Mr Redwood, albeit slightly different.
What about other taxes?
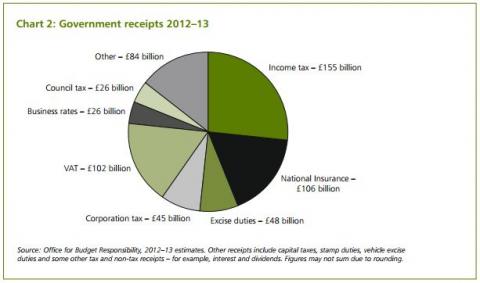
Looking at Income Tax alone doesn't necessarily give the full picture on the relative tax burden placed on the wealthiest in society, as it only represents around a third of total tax receipts, according to the Budget.
The ONS breaks down the impact that some of these different taxes have on household incomes in its 'The effects of taxes and benefits on household income' series.
Looking at this data we can see that whereas richer households generally pay proportionally more of their income in Income Tax than other households (the highest-earning decile pays 19%, whereas the bottom five deciles all pay less than 10%), this isn't true for other types of tax.
For example, when it comes to National Insurance, the richest households contribute 4.7% of their incomes, which is less than those families in the 7th, 8th and 9th deciles, and only marginally above the average for all households (4.5%).
When we factor in indirect taxes such as VAT and fuel duty, the disparity between richer and poorer households in the tax they contribute continues to shrink, and the ONS records that the wealthiest 10% of households pay approximately one third of their declared incomes (33.6%) to the Treasury through the taxes considered in the series.
By way of comparison, all but the poorest decile contribute at least 29.2% of their household incomes in tax, and the mean household contribution stands at 32.9%.
Is this the end of the story?
Even the ONS data doesn't consider the impacts of all possible taxes, however.
Some taxes, such as Capital Gains Tax and Inheritance Tax, aren't included in the breakdown. So do we know what impact (if any) this has on our analysis?
The simple answer is no: data on the distribution of receipts for these taxes by income brackets isn't readily available.
What we do know is that these taxes don't represent as large a slice of Government revenues as the other taxes considered. According to the Budget, in 2012-13 Capital Gains Tax was predicted to swell Treasury coffers by £3.8 billion, while Inheritance Tax was expected to bring in £3 billion, both far below the sums considered above.
However there is some reason to believe that these taxes may hit richer people harder.
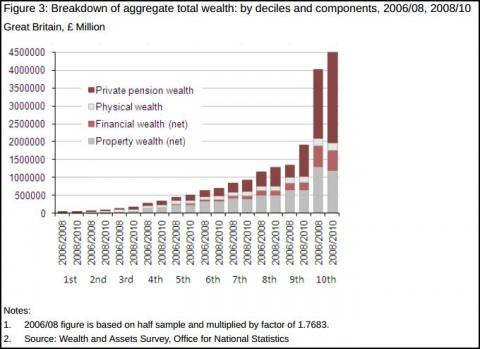
For example, we can see from the ONS's Wealth and Assets Survey that the richest 10% hold more of their wealth in assets, such as pensions and property, than is typical among the rest of the population. (We should point out that here we are looking at 'wealth' - the value of an individual's income and assets - rather than income alone.)
Of course this doesn't mean that these individuals are paying tax on these assets, although according to a Parliamentary Answer in 2005, over a third of those claiming Capital Gains Tax tapering relief were in the wealthiest 10% of the public.
Conclusion
While we don't necessarily have a complete picture of the relative size of the tax burden shouldered by the wealthiest 10% (or indeed by the 10% of highest earners), we can get a fair idea of the sums being paid through all but a few taxes.
Significantly, the picture is strikingly different depending upon whether you focus on Income Tax alone, as John Redwood does, or look at taxes in the round. Similarly, the Daily Mail is right that the top 10% of high-earners includes some three million people earning over £50,500.
However if you consider the broader picture, the contribution of the richest 10% relative to their income is not too dissimilar to other income deciles, so there is plenty of room for discussion in the political argument that Nick Clegg has started at this year's conference.