What was claimed
Parts of London have the highest productivity in Europe.
Our verdict
This is correct by one measure, but it isn't based on a fair comparison.
What was claimed
Parts of London have the highest productivity in Europe.
Our verdict
This is correct by one measure, but it isn't based on a fair comparison.
What was claimed
The gap between productivity in London and the UK’s 2nd, 3rd and 4th cities is greater than in any other major economy in the world.
Our verdict
There is a significant ‘productivity gap’ between London and other cities in the UK; and it does seem to be relatively large compared to the largest European economies. We haven’t seen an analysis wide-ranging enough to claim that it’s greater than all other major economies.
In a speech at the 2016 Conservative Party conference, Philip Hammond spoke about a gap in the ‘productivity’ of different parts of the UK.
The Chancellor opened:
“Parts of London have the highest productivity in Europe…”
Philip Hammond, 3 October 2016
This claim is correct on one measure, but it’s not based on a fair comparison.
He continued:
“…The bad news is that the productivity gap between our capital and our 2nd, 3rd and 4th cities is greater than in any other major economy in the world.”
Philip Hammond, 3 October 2016
It’s true that there’s a significant gap between London and other UK cities, but so far we haven’t found an analysis that would support such a wide-ranging claim.
Join 74,000 newsletter subscribers who trust us to check the facts
Sign up to get weekly updates on politics, immigration, health and more.
Subscribe to weekly email newsletters from Full Fact for updates on politics, immigration, health and more. Our fact checks are free to read but not to produce, so you will also get occasional emails about fundraising and other ways you can help. You can unsubscribe at any time. For more information about how we use your data see our Privacy Policy.
At its simplest, labour productivity means what it say on the tin: it’s how much we get done for the work we put in.
‘How much we get done’ means the value of what we produce – our output. It’s called Gross Value Added (GVA) for smaller areas like cities and regions, which adds up to the whole economy’s Gross Domestic Product (GDP).
‘The work we put in’ could be measured a few different ways. You could divide output between the number of workers, or between the number of hours worked. The Office for National Statistics publishes statistics on both.
A very basic measure of productivity is to divide an area’s output by the number of people who live there, what’s called ‘GVA per head‘ or ‘GDP per head’. This can give a rough approximation of productivity across a whole country, but it poses problems when it’s used to compare smaller areas like cities. If someone commutes into a city to work, they raise the city’s output but not its population. That makes the city seem more productive than it actually is.
Labour productivity doesn’t just tell us how hard people are working.
It’s generally seen to have more to do with things like infrastructure, education, management and technology. As an example, having a computer will make you more productive than having a filing cabinet, even if you put the same amount of effort into your job. As the OECD puts it, “Productivity is about ‘working smarter’, rather than ‘working harder’.”
Unfortunately, there’s no single answer on how to do this. The slow growth of UK productivity is a ‘puzzle’ that’s open to debate.
…but what’s an NUTS2 region? Exactly.
We don’t know what data Mr Hammond was basing his claim on and we’ve asked the Treasury to comment. This eye-catching graph from the EU’s statistical agency is a possibility.
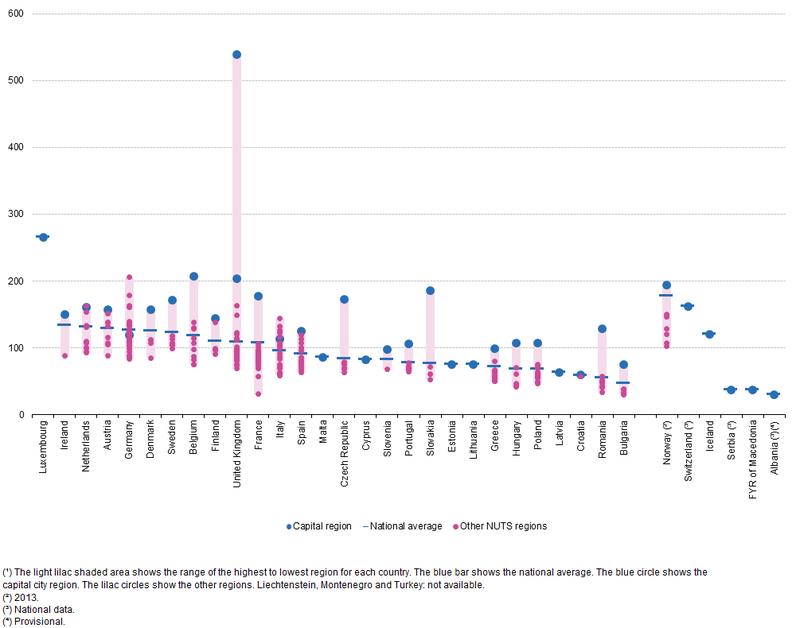
But watch out.
It’s not comparing cities or city areas. It’s comparing a kind of statistical area called an ‘NUTS2 region’.
NUTS2 regions aren’t consistently sized in different countries. In most EU countries they map on to a system of national administrative units. They can have a population anywhere between 800,000 and 3 million people.
So there are two problems with drawing conclusions about productivity from this graph.
First, comparing NUTS2 regions isn’t comparing like-with-like. London is made up of five different regions, whereas cities like Berlin and Paris are only made up of one. Is it useful to compare the innermost part of a city like London with all of Paris and its suburbs?
Second, commuters make parts of London seem more productive than they would otherwise. Many people travel to work in East and West Inner London (the two blue dots) but don’t live there. Some come from London suburbs, some come from outside of London all together. Commuters increase Inner London’s output compared to the number of residents, boosting its ‘GVA per head’ and its apparent productivity.
Luxembourg, Brussels and Hamburg also have lots of commuters, so looking at ‘GVA per head’ makes them seem very productive too.
Commuters don’t distort the picture if you compare output per worker, rather than output per head of population.
On that measure, London was the 21st most productive city in Europe in 2011, according to estimates from the Centre for Cities.
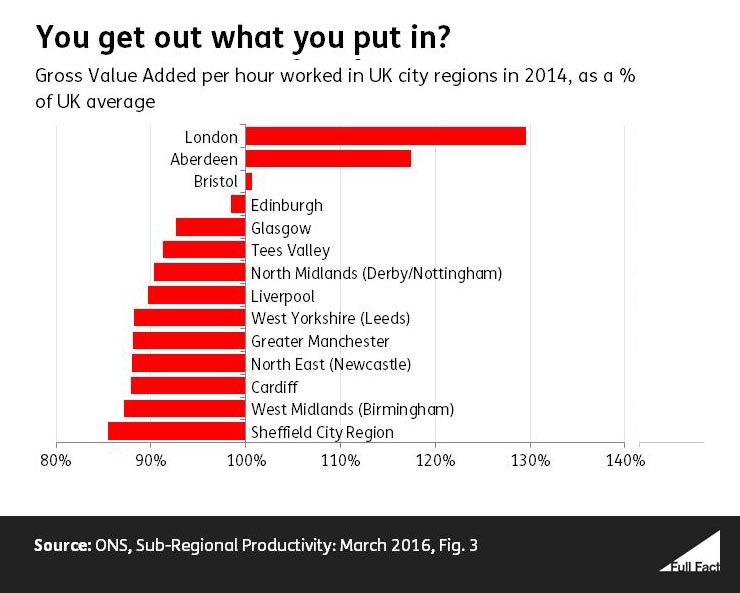
Labour productivity in London is much higher than in other cities in the UK. On average, an hour worked in London is nearly 30% ‘more productive’ than the UK average.
The Office for National Statistics told us that it doesn’t produce international comparisons for the productivity of UK cities, although it may in the future.
The Centre for Cities recently published a set of estimates that allows us to compare the productivity of different cities in Europe in 2011, as measured by their output per worker.
Back then, the ‘productivity gap’ between London and other UK cities was relatively large. If we compare the four biggest cities in the UK to those in Germany, France, Netherlands, Spain, and Italy, the gap between the most and least productive was bigger in only one case. 
Not all capital cities were the most productive. Berlin, the capital of Germany, produced 28% less per worker than Munich in 2011.
The situation may have changed since then, and no precise estimate will be definitive. The exact figures would depend on how you defined the city boundaries. Centre for Cities have one definition of ‘primary urban areas’; Eurostat have another.
And there’s some debate about what makes a ‘second city’. We’ve chosen Manchester, Birmingham and Glasgow because they had the 2nd, 3rd and 4th biggest populations in 2011, according to the Centre for Cities. If you have a different view on what makes a ‘second city’, you can make your own comparison using the same data tool.
Full Fact fights for good, reliable information in the media, online, and in politics.
Fact checking claims made by politicians, public figures and viral online content can give you the full picture backed by the evidence.
Subscribe to weekly email newsletters from Full Fact for updates on politics, immigration, health and more. Our fact checks are free to read but not to produce, so you will also get occasional emails about fundraising and other ways you can help. You can unsubscribe at any time. For more information about how we use your data see our Privacy Policy.
_per_inhabitant_in_purchasing_power_standard_(PPS)_in_relation_to_the_EU-28_average,_by_NUTS_2_regions,_2014_(%25_of_the_EU-28_average,_EU-28_%3D_100)_RYB2016.png)