ERROR: This tweet no longer exists.
This viral tweet from the Spectator Index (which is in no way linked to the Spectator magazine) ranks the poverty rate of a number of different countries in Europe.
But it’s incorrect to suggest that the UK’s poverty rate is higher than other European countries like Spain, Greece, and Italy as the tweet does. That’s because the measure of poverty used for the UK here is different to the one used for all the other countries—it’s also looking at a different year.
Although the tweet says that the figures relate to 2018, they seem (with the exception of the UK figures) to be figures for 2016.
Looking at consistent figures on the proportion of people “at risk of poverty” in the UK in 2016, we can see the comparable UK figure is around 16% (just below the EU average) rather than 23%.
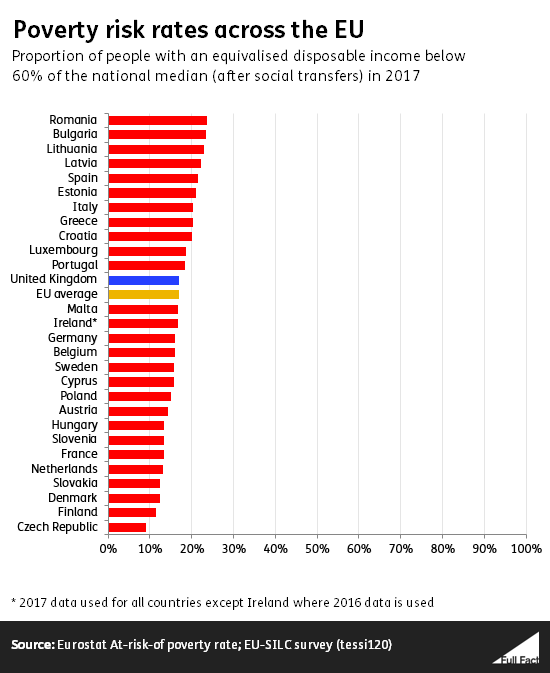
The most recent figures we have, using this measure, are for 2017. These place the UK twelfth out of the 28 EU countries and at almost exactly the same level as the EU average (17%).
The UK figure is based on a different measure of poverty
Most of the figures used by the Spectator Index—and the figures in our chart above— look at the “at-risk-of-poverty” rate in each country. This measures the proportion of people at risk of poverty after “social transfers” have been counted—things like pensions and benefits.
Specifically that means people whose take-home pay after benefits are less than 60% of the national average (median). These figures are published by Eurostat, the EU’s statistics agency.
But the UK figure used by the Spectator Index is from a different source entirely—a UK-based think tank called the Resolution Foundation.
It told us its measure is an estimate of the proportion of people whose income is below 60% of the median income, after housing costs have been paid in 2017/18. Adjusting for housing costs tends to show more working-age people at risk of poverty than measures when housing is not adjusted for (in the UK at least).
The Resolution Foundation’s figures are based on official poverty figures produced by the Department for Work and Pensions, but these only go to 2016/17 at the moment.
The post from the Spectator Index has led to a number of similar posts reporting on the figures, some of which make it appear as though the UK has the highest poverty level in Europe—which is also incorrect.
There are many ways to define poverty
There isn’t one set definition of poverty. Most of the claim’s data refers to a poverty measure published by Eurostat, but Eurostat also has other poverty measures. In the UK the government publishes a number of measures, as do other organisations like the Social Metrics Commission.
Comparing countries using different poverty measures, can make them look better or worse than they actually are—so consistency is important.
One of the reasons that there are so many measures available is that it’s not always clear how to measure what we might think of as “poverty”. Looking at 60% of the median income is one way to do so, but the Office for National Statistics points out that a low income doesn't necessarily imply a low standard of living.
Comparing these countries doesn’t take into account the living standards in each country either. For example, the Eurostat measure says that people living with less than 60% of the median income are all at risk of poverty. But your standard of living (in terms of things like housing, prices and food availability) could be a lot higher in one country than another, even if you’re on the same level of income.
Finally, relative poverty measures such as this one—which compare everyone’s incomes in a specific year—can lead to some odd outcomes. For example, if the incomes of richer people in a country fell while everyone else’s stayed the same that would reduce the median income. As a result fewer people would be classed as “in poverty” even though their incomes hadn’t changed.
We’ve looked before at some of the pros and cons of the official measures published in the UK.