Why are MPs in line for a pay rise?
MPs currently earn £66,636 annually, roughly £40,000 more than the average annual wage.
It's with this in mind that many reacted with shock when the MPs' expenses watchdog - the Independent Parliamentary Standards Authority (IPSA) - announced proposals to give them a pay rise.
The recommendations for a new salary package include an 11% rise in an MP's current salary, bringing their annual pay to £74,000 starting from 2015. This would be indexed to changes in average earnings in the whole economy. The proposals also envision a new pension on a par with that of other public sector employees, replacing "resettlement payments" with "more modest" redundancy packages, and finally "a tighter regime of business costs and expenses", which will see an end to the likes of free evening meals.
How MPs' salaries have grown, compared to the average wage, since 1911
Join 74,000 newsletter subscribers who trust us to check the facts
Sign up to get weekly updates on politics, immigration, health and more.
Subscribe to weekly email newsletters from Full Fact for updates on politics, immigration, health and more. Our fact checks are free to read but not to produce, so you will also get occasional emails about fundraising and other ways you can help. You can unsubscribe at any time. For more information about how we use your data see our Privacy Policy.
Members of the House of Commons received their first pay cheque 102 years ago. Prior to 1911, MPs were unpaid and relied on their personal wealth. This, according to Dr. Paul Seaward, Director of History of the Parliament Trust, was due to a "deep and common unease about the creation of a class of professional politicians".
Their first pay (seen in the graph below in real terms) was £400, roughly equivalent to £40,000 in 2011 prices. The then Chancellor Lloyd George described it as:
"not a recognition of the magnitude of the service, it is not a remuneration; it is not a recompense; it is not even a salary. It is just an allowance, and I think the minimum allowance, to enable men to come here..."
(Source: IPSA, House of Commons Library and Written Evidence from Dr Paul Seaward. NB: inaccurate dates from IPSA's original graph have been removed from ours.)
As we can see, in real terms an MP's salary has gone up at a higher rate than the average worker's wage. However, between 2002 and 2008 MPs' pay declined in real terms. The CEO of IPSA observed that this was at a time when the trend in the UK average earnings had been "upwards".
Is it fair to compare MPs' wages to average earnings?
The yellow line in the graph above illustrates MPs' salaries as a multiple of the average wage. So while their first salary was around five and a half times greater than the average wage, it is currently less than three times as high.
This is how the multiple has evolved over the years.
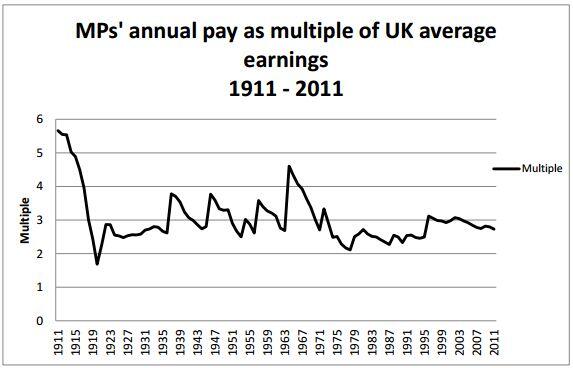
In a blog post on IPSA's website, John Sills, Director of Policy and Communications at IPSA, alludes to the fact that the link to average earnings - which has historically oscillated around a multiple of three - can and should inform how the new salary is established.
To justify the proposals, IPSA have also argued in their latest report that: "If we look at the period from 1911 — when MPs were first paid a salary — to 1980, the start of the decade in which the expenses/remuneration confusion began, we find that MPs' pay was 3.16 times average national earnings. Over the years since 1980, the ratio has fallen to 2.7."
How do MPs' salaries compare to that of their Westminster neighbours?
Westminster North, the UK's highest earning constituency registered an average annual pay of £39,745 in 2011. Provisional figures for 2012 from the Annual Survey of Hours and Earnings put Westminster North's salaries at £38,622, which could mean (these are provisional figures after all) that Westminster salaries have suffered a further drop (-2.8%) since 2011.
The Guardian's datablog has mapped the data here.
How do MPs' salaries compare to earnings in other professions?
IPSA has argued that MPs' pay is around 80% of what other public sector professionals, such as headteachers, usually earn.
To advance its case, it published a table using data gathered by PricewaterhouseCoopers and commissioned by the Senior Salaries Review Body (SSRB) in its 2007 Review of Parliamentary Pay and Allowances.
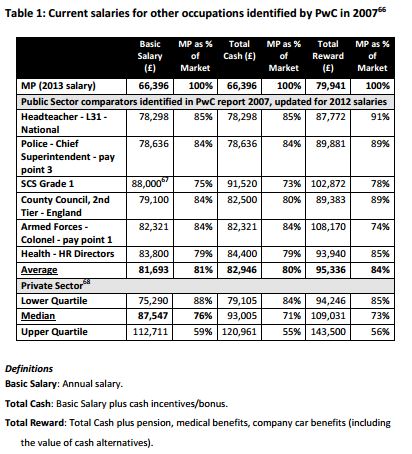
Is the comparison entirely fair? MPs are allowed to write columns for newspapers or take jobs and sit on company boards; headteachers and members of the armed forces are seldom afforded the same luxury.
How does an MP's salary compare to other high profile occupations?
Currently MPs earn £1,276 per week before taxes. If IPSA's proposals are approved, that will increase to £1,423.
We had a look at the ONS's Annual Survey of Hours and Earnings (2012) and found that the median gross weekly pay of doctors is £1,067 (£55,484 per annum). Legal professionals earn around £1,149 per week (£59,748 pa), while chief executives and senior officials top the league with £1,513 (£78,676 pa).
How do we compare to other democracies?
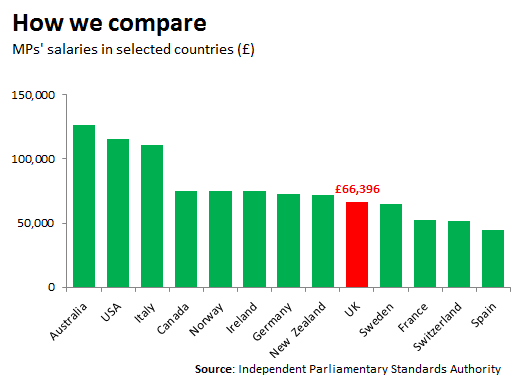
In terms of salaries of democratic representatives, the UK is in 10th place out of the 14 countries selected by IPSA in their October 2012 report. We've added to this list the salary of members of the United States House of Congress ($174,000 - see page 10).
This graph could perhaps do with a greater selection of countries, so as to offer a more comprehensive perspective on our MPs' earnings. IPSA's selection of countries has raised some eyebrows, including those of the Guardian. As these aren't countries in a ready-made group, like the G8 or the OECD, the selection isn't immediately clear.
In the aforementioned 2007 report on MPs' pay, the SSRB said that international comparisons aren't always helpful, given that "the roles and job weights of members of parliament in different countries vary considerably depending on factors such as the number of voters represented" - an important factor in establishing MPs' salaries - and "whether the system is unicameral or bicameral, and whether members represent a defined constituency or are elected on a party list."
Leaving those caveats aside, the report concluded that "British MPs' salaries, pensions and expenses are at least on a par with their European counterparts."
When we asked, ISPA explained that its choice of comparator countries was simply driven by which countries they were able to get the best data for, without trying to account for the diverse natures of the assemblies involved.
UPDATE 12 Dec 2013: Updated the article to include IPSA's explanation of why the comparator countries were chosen and to link to the latest estimate of average annual earnings.
---
Flickr image courtesy of UK Parliament