Are 90 pupils a day suspended from primary school for violence?
"NINETY primary pupils sent home every day for attacks in class."
"The worst deterioration in behaviour is being seen in the most affluent parts of the country."
Daily Mail, 26 July 2012
"Nearly 90 primary school pupils a day suspended for violence."
The Metro, 26 July 2012
With the one year anniversary of the London riots fast approaching, the behaviour of the country's youths found itself in the spotlight again today after the Daily Mail and Metro reported on violent behaviour in school classrooms.
According to these reports, 17,000 primary school pupils were suspended for violence last year, the equivalent of 90 suspensions every day. The Mail also claimed that the most affluent parts of the country had seen the worst deterioration in children's behaviour.
So will the stats support the claims?
Analysis
The Mail points to 'figures issued by the Department for Education (DfE)' as the source of its claim.
These were released yesterday in a statistical first release by the DfE on 'Permanent and Fixed period exclusions from schools and exclusion appeals in England, 2010/12'.
Table 12 of the report offers details on the number of fixed period exclusions (FPEs) in primary schools during the 2010/11 school year and the given reason.
The table shows that, most recently, there were 9,160 FPEs for 'physical assault against a pupil' and 7,830 FPEs for 'physical assault against an adult' giving a total of 16,990 (rounded to 17,000 by the Mail).
The graph below presents the data from the past five academic years which shows that, although the 2010/11 figure is up on 2008/09 and 2009/10, it is less than the number for 2006/07 and 2007/08:

The DfE release does not publish an average number of exclusions per day, but it is reasonably straightforward to work it out from what we know already.
According to the DfE:
"All maintained schools and non-maintained special schools must open to educate their pupils for at least 380 half-day sessions (190 days) in each school year, unless this is reduced by Parliament".
If we divide 17,000 by 190, we get a decent estimate of the average number of exclusions per school day which works out at 89.5, which supports the Mail and Metro's claim.
Should we blame the wealthy?
The Mail also claimed that:
"The worst deterioration in behaviour is being seen in the most affluent parts of the country... [with] the number of suspensions [increasing] most sharply in the country's wealthiest areas."
The DfE's publication also has data on the total number of FPEs (and we should note here that these aren't just FPEs for physical assault) broken down into deciles according to the school's deprivation level based on the 2010 Income Deprivation Affecting Children Index.
The table below shows this data for the last four academic years:

[0% = most deprived]
Although we can see a significant increase in the number of FPEs in the top two deciles between 2009/10 and 2010/11, the greatest recorded increase between these two academic years was in the fourth decile where the number of FPEs increased by 440.
This would suggest that the worst deterioration in behaviour year-on-year was not in the most affluent parts of the country but in a lower-middle income decile. It is worth noting that this remains the case if we split the data into pentiles too.
The graph below shows the trend in number of FPEs for each decile over the past four academic years:

Over the longer term however the Mail might be on to something, as the two wealthiest deciles are the only ones that have seen an increase in FPEs over the four year period.
We do need to be a little careful with this approach however, as there is a good deal of variation year-on-year, which could signify a trend, or could simply be noise. For example, exclusions in the top income decile have actually declined from a peak of 1,600 three years ago.
Another potential pitfall is that the distribution of schools among the income deciles doesn't necessarily match the number of pupils taught at each.
However, the DfE also records the number of FPEs as a proportion of the total school population and we can see from this that the increase for the fourth decile remained larger than that of the tenth (and marginally larger than the ninth) between 2009/10 and 2010/11.
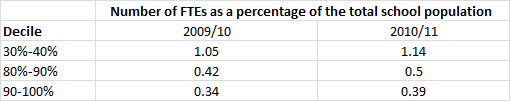
When we look at the data in pentiles (by taking an average of the two adjacent deciles) we can also see that the increase in the number of FTEs as a proportion of the school population between 2009/10 and 2010/11 for the second pentile remained larger than that of the fifth.

Conclusion
The Mail and the Metro are right that there were an average of 90 exclusions per day last year, although it's important to note that this only applies to school days.
Whether or not richer areas are seeing larger rises in exclusions than poorer ones remains moot, as it depends upon the timeframe considered. An analysis of the year-on-year change suggests that lower-middle income deciles might have seen bigger increases, but it is true that over a four year period the top two income deciles have seen the largest jump.
Whether or not that is significant is difficult to say, as there is a great deal of volatility in the data which means different trends can be traced over different periods.